so I’m at the part where i need some kind of embedded profiling in my application, to pinpoint the slowest parts.
After doing this for the weekend using rough System.currentTime() and println of the diff.
While this worked quite well from the result point of view, this is barely an acceptable solution for longterm.
I kinda plan to profile all most important parts of my game kinda in realtime, similar to what other engines offer.
Eg source engine;
So the question is, does anyone know a good framework for this, that also provides some kind of analysis like averages and maybee even some visualisation?
i use linux, it has 1 ms resolution, and my precision is less than 5ms due to changing system load. Resolution != Precision, no reason to have resolution finer than my precision.
Also currentTime uses about 100clock cycles, while nanotime has a higher overhead.
Not sure what this means. You mean because you are only displaying 1 ms precision that only 1 ms precision matters? And yeah, precision is what I meant. On Windows, typically 10 ms precision from currentTimeMillis().
System.nanoTime() is 1 nanosecond precision so nothing is rounded up or down or anything. I generally track all timings with nano timer and then reduce for display. And it would allow your profiler to be more ‘precise’ even on non-Linux platforms.
…also, it’s generally using the built in high resolution CPU timer rather than the wall clock time of currentTimeMillis().
I see what you’re saying about “frameworks” here, but why not just use the profiler built-into NetBeans, or any of the (many, very good) profilers for Java. They’ll show you much more detail about what’s happening.
I’ve used the NetBeans built-in profiler to optimize jME3 for both memory allocation and performance. I never had to use currentTimeMillis or nanoTime for anything.
VisualVm is the netbeans profiler or?
My problem is that it crashes my gameServer after some time randomly with the profiler attached.
Apparently this is due to me having some bytecode manipulation in the works via project lombok.
@pspeed what i mean is, that the measurements are changing between 1-3 ms for the same method call, due to other factors of my system for each call, so having ns accuracy is not worth much, 1 ms is more than enough for my use case.
I can only agree with them, if you look at the way both are working on the assembler level, it is obvious that currentTime is way faster due to the hpet useage, while nanotime actually needs more work. But anywayy 1ms accuracy is more than enough for me. (heck even 10 ms accuracy would be enough).
Also non windows newer than 7 with a compatible system has less than 1 ms accuracy.
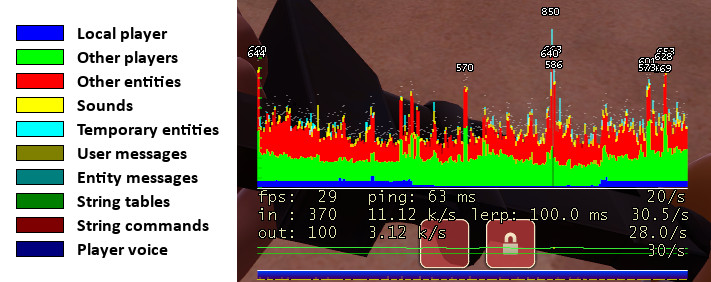
+1 for using the profiler, but to display a view like your exemple in the source engine, you use the chrome trace view. I use it 2 years ago (link to the doc in the source)
I would definitely expect that from currentTimeMillis(). The way it collects time just isn’t that accurate compared to nanoTime(). You might try switching and dividing just to see if you still get so much variation.
When I talked about profiling, I meant tapping right into the API that profilers use to do their jobs. Though having an app profile itself might be a little weird, you could always spawn a second process that hook in or something. Honestly, I’ve never used the API so I don’t know how it works. I used the debugging API once like a decade ago so all of my knowledge is probably out of date anyway.
jvisualvm is part of the standard JDK from Oracle, looks like netbeans has its own, which I have not had a chance to use.
jvisualvm can affect performance when in profiling mode. If you are just trying to watch a few basics, you may find the sampling mode handy, can watch CPU use per method. There is also the JMC (Java mission control) also part of the JDK. Supposed to be much less intrusive in terms of performance penalties. These tools are intended to be used for profiling locally, or a remote machine that you control such as a server. They are less useful if you want every copy of your game to log profiling data, as they are separate stand-alone programs.
Sadly visualvm does more than just having a performanc eimpact (at least the profiler, the sampler works fine)
It manages to throw a few class redefinition errors and then kills my gameserver
But yes, the reason why I want to embedd it, is also to allow profiling of any client and uploading the data in case of problems. I actually do not care really about specific method timings, more about the amount of time for different subsystems of the engine. Like physic stepping, physic applying ect.
As things look, I might try using a AnnotationProcessor for this, or test compile time weaving with aspectj.
I will test with nanotime, worth a shot anyway. If I’m actually the first person to see the need for such a framework, allowing different timer implementations to be used is a must anyway.
I don’t think it does anything too special that the Netbeans memory profiler doesn’t. At least, I’ve never had a memory leak I couldn’t find with the profiler plugin.
Ok, @pspeed i tested with nanoTime by now, the results are mostly identical, even with similar variation. I was not able to find any statistical relevant difference for my test cases. (All of them are method calls in 20-100 ms range. For smaller methods with <5ms this of course makes a huge difference (eg 1.5ms is 50% more than 1ms)
So this is advocating for nano time, yes? Else you could only have measured 1 ms or 2 ms… and 2 is 100% more than 1 but incorrect if it was really 1.5 ms.
this library looks really good, seems to be exactly what I’m looking for
It seems to handle all those pesky details for me with an acceptable performance.