Hello Guys,
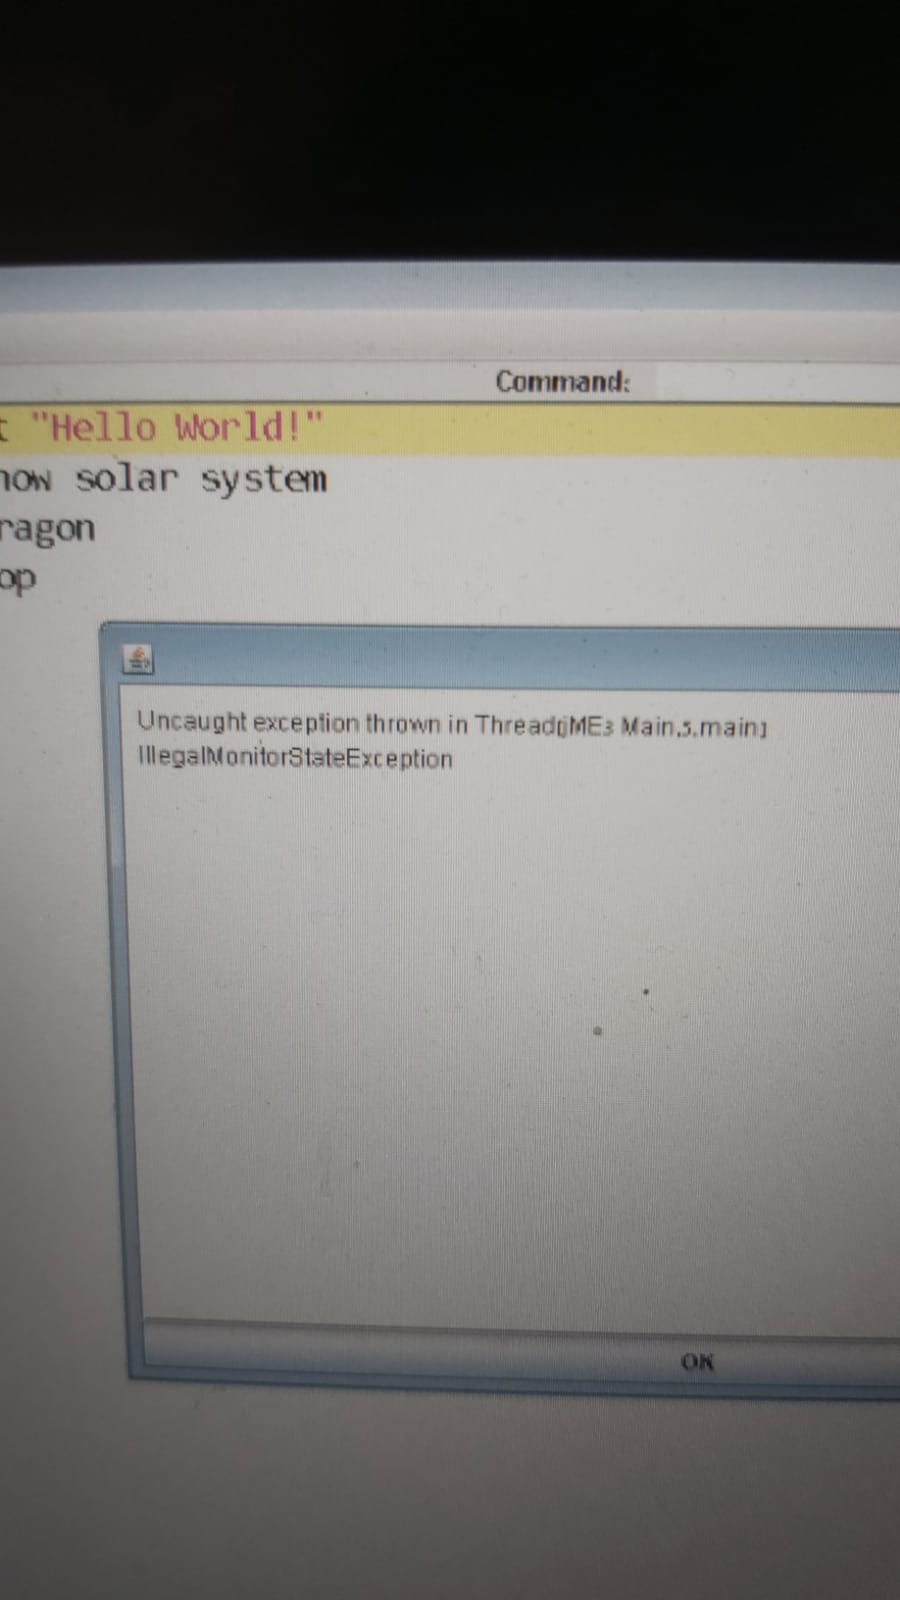
About 1 of 20 kids using my JME based product gets an “IllegalMonitorStateException” (see below pic). I always instruct them to downgrade Java and I think it solves the problem most of the time but I would like to better understand the root cause of this so I saw that JME has this capabilities Enum ability:
So I’m asking will this capabilities output give me a hint of what caused that exception in JME? or does JME has a separate diagnostic tool or maybe OpenGL has a useful tool for that?
It’s not happening on any of my test computers but when a lot of people are using your product on a variety of machines things happen. This is a relatively common issue.
Ill add a stack trace print to the exception dialog and report when it happens again.
But my question was not how to sort it out. I want to understand if there is some GL/JME diagnostic tool that can give a clue about possible issues
I think this is just a Java problem. I did a quick code check on JME and all the stuff there seems to be well synchronized. So we’ll just need the stack to provide you a possible solution. And GL/JME diagnostics wont do any good here.
It might as well be a ConcurrentModificationException, for example.
I mean, sure there is… JME is already managing a thread and there was the main thread. I guess you don’t use Swing or networking or anything else at all… no additional libraries that might use threading… no bullet physics that definitely uses threading… etc…
My suspicion is that you are incorrect about that statement, though.
edit: anyway, this is actually impossible to help without a stack trace. I’m really curious what’s reporting the exception that isn’t already including the stack trace.
(Thought note: I work daily with experienced developers that STILL forget to include the “, e” in their log error messages. I want to scream.)
I’m not even sure that it’s my error screen. Maybe Swing has a general exception caught dialog?
In case that it’s not my dialog, I assume putting a try-catch block around the SimpleApplication creation code is good enough to catch these errors with a meaningful stack trace?
Or do you recommend a better practice?
I remember having something like that , when trying to run or modify a jme app from another context(i.e swing thread) , i mean if you have an editor that basically runs a jme application implicitly , you may check it .
Thrown to indicate that a thread has attempted to wait on an object’s monitor or to notify other threads waiting on an object’s monitor without owning the specified monitor.
This is a bit unrelated to your question, but you might want to check out jlink - it’s been available ever since Java 9, and it lets you bundle a JVM customized to your applications needs with your application. This almost certainly won’t solve your problem (odds are extremely high that a bug outside of the JRE is causing the monitor issue, and different handling of monitors between different JVM versions is causing the bad state error to increase or decrease in frequency).
At least running in your own JVM (a) frees the user from having to manage a Java install, (b) frees you from the Java management mistakes users inevitably make, and (c) gives you a consistent baseline for debugging issues like this.