public final static int VERSION = 1;

private static final int gridSize = 5000;

public static final int TCP_PORT = 8080;

public static final int UDP_PORT = 8080;

public final static ObjectStateProtocol OBJECT_STATE_PROTOCOL = new ObjectStateProtocol(8, 64, new Vec3Bits(-200, gridSize + 200, 16), new QuatBits(12));

public static final ZoneGrid ZONE_GRID = new ZoneGrid(gridSize, gridSize, gridSize);

public static final Vec3i ZONE_RADIUS = new Vec3i(3, 3, 3);
Two things here. 1) if your max bbox ‘radius’ is 100 then +/-200 is a lot bigger than you require… but no big deal. Your grid size is pretty huge anyway.
because if the huge size of your grid, 16 bits is probably not enough to accurately represent position. At least not down to sub-millimeter. I guess you get 7 cm accuracy. (5000 / 2^16)
my smallest spatial radius is .001 units and largest spatial radius is about 100 units … camera near frustum is .01 so with interpolation in place and the fact that ships don’t just wiz by since it’s a true scale space game, 16 bits is actually to much but going down to 7 bits is a negligible bandwidth difference.
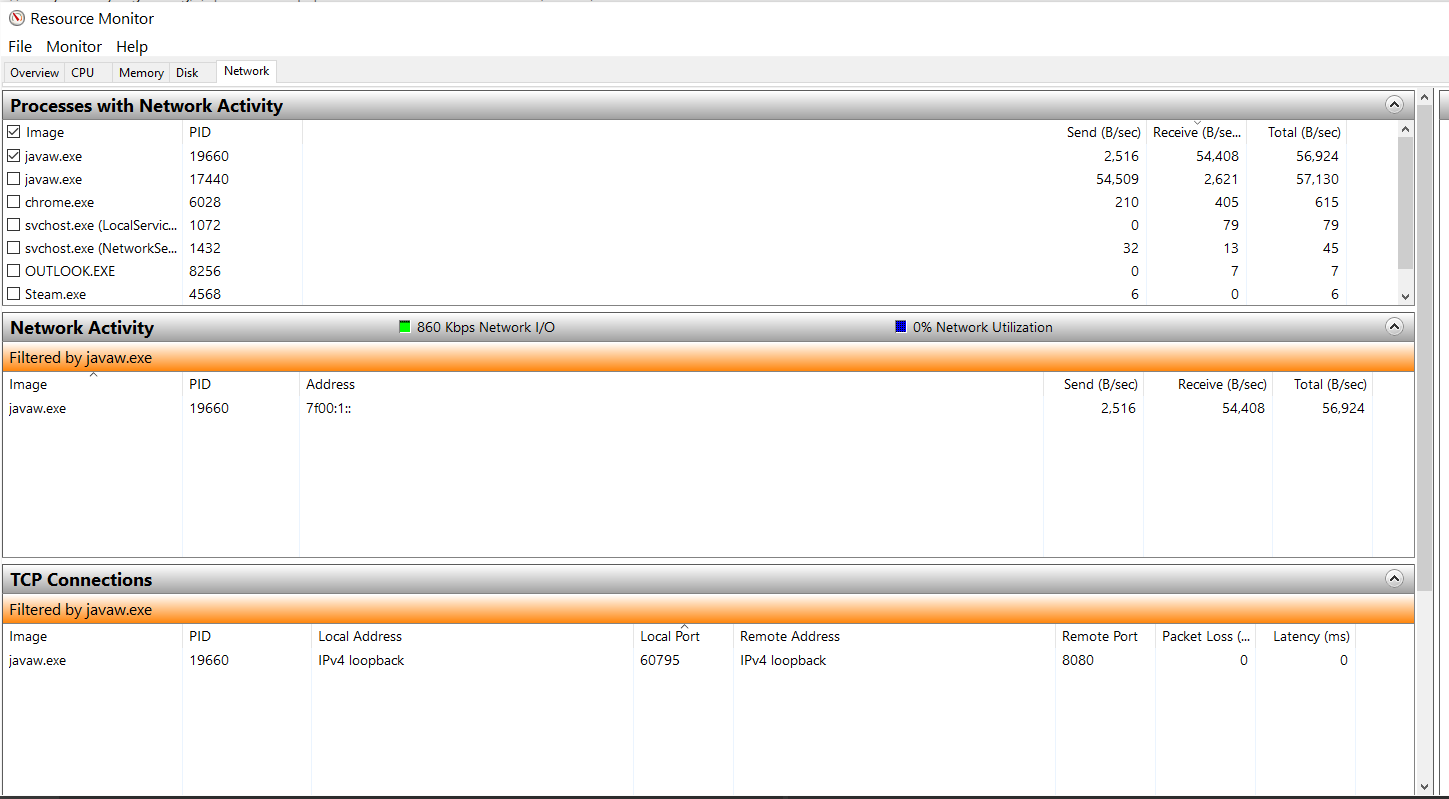
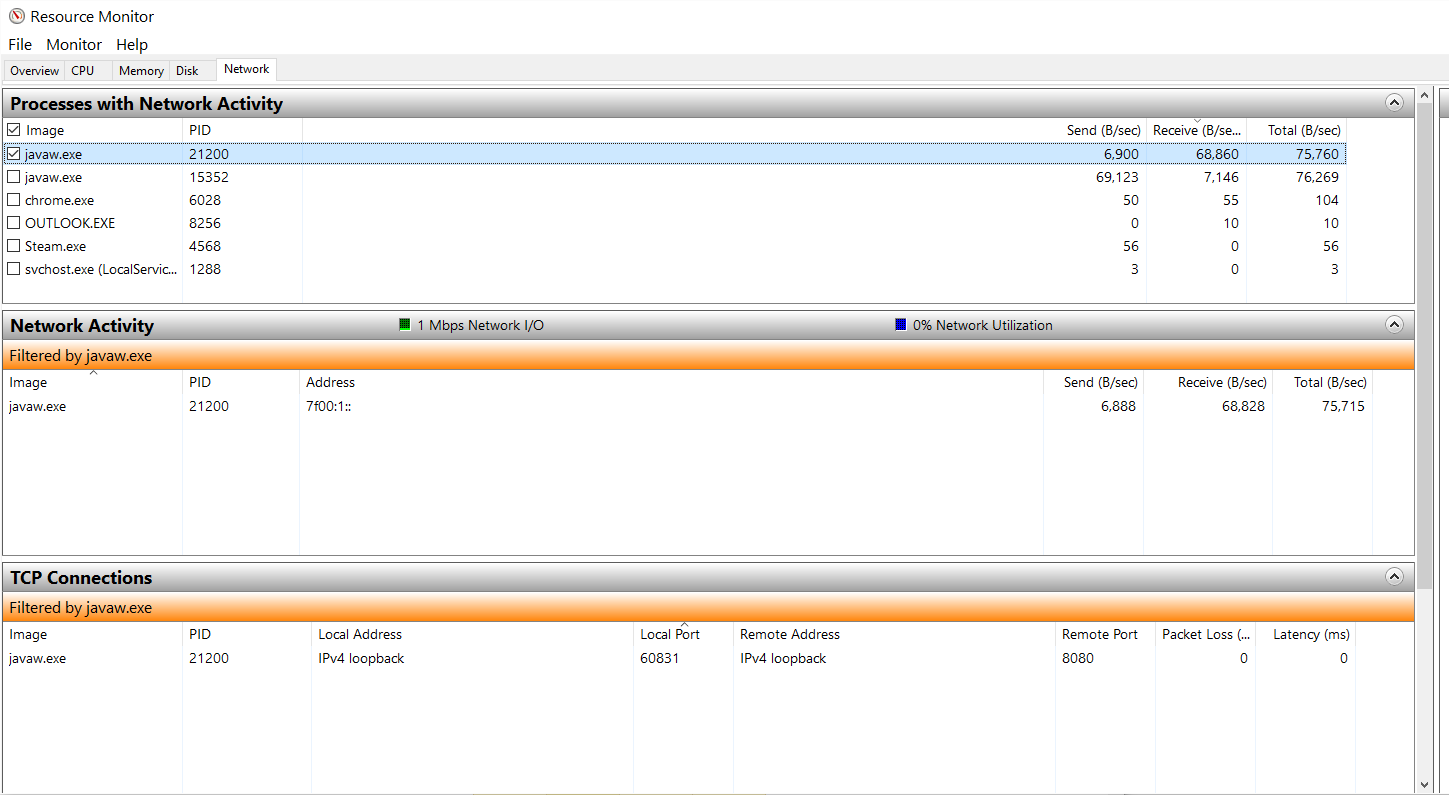
Speaking of bandwidth, I did a test with 250 entities in a scene … first with all of them moving and rotating and then with all of them standing still and the bandwidth between both is not much different. I would have expected a huge drop if they are standing still.
the two IDs and a few bits to signify nothing else is coming.
I think there is a reason I have to send some message even for no change but I don’t remember what it is. However, no parent, position, or rotation will be sent in that case.
Edit: and I also would have expected the different to be much greater.
Edit 2: I can’t make the numbers work either way… how many frames per second are you calling beginUpdate/endUpdate on the server?
The part I can’t make work is the math if you work out what the theoretical data sizes should be for 250 moving/rotating entities.
60 (frames) * 250 (entities) * (8 + 64 + 16 * 3 + 12 * 4 + 5)
= 2595000 bits per second… or 324375 bytes per second.
I can’t make that match with your numbers. There’s some per frame overhead but it can’t account for the difference.
Frame overhead: 208 bits per frame… * 60 = 12480 bits/frame or 1560 bytes.
Even considering that you are viewing raw network traffic and must account for the UDP header size and so on… it seems the differences are too much. But maybe I’m not looking at it right.
By the way, 64 bits for your network ID size is WAAAAAAAY too big. This is not the size of your entity IDs. It’s the size of the network objects IDs and they are reused (round robin) and mapped to your entity IDs dynamically. Really 16 bits should have been fine unless you expect to have more than 65,000 active networked entities at the same time. If you could bring that back down to 16 bits then you save 6 bytes per message.
Edit: some other message overhead I forgot about are the acks… but in this case where you aren’t losing packets then that should be pretty small. Though it could be that since your messages will be split that this increases a bit I guess.
If you get really adventurous you could add some logging to the StateWriter to count what is actually being sent. I think you can count it just in endMessage().
I thought that even though I am calling updateEntity() at 60 ticks you are internally doing some magic to always broadcast at 20 ticks. Is this the case? I also let the test run overnight and now my bandwidth went to 0 and I am getting this msg printed every second to the console “collect underflow FPS:0”
It will buffer as many as 3 ticks… but if the max message size is exceeded then it will send messages early. Better to send many small UDP messages than one giant one as large UDP messages will be split up to fit under the overall MTU if the pipe… and if any of those parts fails to arrive then the UDP message is lost.
As to the message, it’s a temporary watchdog I added for some reason but I no longer remember why. It’s showing you that you are getting less than 20 “collections” per second… in this case 0. But I don’t immediately see how that can even happen given the logic of the loop:
            long lastTime = System.nanoTime();
long counter = 0;
long nextCountTime = lastTime + 1000000000L;
            while( go.get() ) {
                long time = System.nanoTime();
                long delta = time - lastTime;
                if( delta < collectionPeriod ) {
                    // Not time to collect yet
                    continue;
                }
                lastTime = time;
                try {
                    collect();
                    counter++;
                    //long end = System.nanoTime();
                    //delta = end - time;
                } catch( Exception e ) {
                    collectionError(e);
                }
if( lastTime > nextCountTime ) {
    if( counter < 20 ) {
        System.out.println("collect underflow FPS:" + counter);
    }
//System.out.println("collect FPS:" + counter);
    counter = 0;
    nextCountTime = lastTime + 1000000000L;
}
                // Wait just a little.  This is an important enough thread
                // that we'll poll instead of smart-sleep.
                try {
                    Thread.sleep(1);
                } catch( InterruptedException e ) {
                    throw new RuntimeException("Interrupted sleeping", e);
                }
            }
Ah, it’s meant to tell us when collect() takes so long that we start dropping frames… but I can’t see how counter would ever be 0 because then we’d never even dump the message.
Unless nano time has wrapped and delta is negative. But by my math, it should take years for nanoTime() to wrap. (292 years)
Ah the dreaded System.nanoTime() … I got bit in the ass many times years ago on multi core cpus with it. It’s a piece of useless junk when running on multi-core environments. Here’s a post about it:
When I run my test at higher load … say 2000 entities I get the “collect underflow FPS:0” issue happen as soon as the client connects. I also know that System.nanoTime() has been a problem for me in the past and I avoid it at all costs. I am running on an i7 processor with automatically throttling CPU frequencies at the moment. The CPU throttling that the OS does will cause MANY issues with System.nanoTimer() … I will look into it further since I now know where the code is that outputs this message and hopefully be able to show you empirical data to this statement.
Ok. Last time I saw the nanoTime() problem was on Windows XP on intel Xeon quad cores… in 2003. We updated the system drivers and the problem went away. We left some watchdog code in to make sure time never went backwards and it was triggered twice after that on other unupdated intel boxes.
It occurs to me that it’s also just as likely that there is an exception but the error logging is being suppressed. Because that would cause the same issue over and over.
…where as a nano time issue should only be temporary (by the delta between the core counters). Even back in 2002 when we saw the issue it was just that our graph layouts were stuttering or freezing for a few seconds occasionally.
I will watch for it and report back. On another note, I figures out why my bandwidth shoots up. It’s the fragmentation of big packets … so I changes my code to do a bigginUpdate() and endUpdate() for each entity in hopes of sending smaller packets and that just cause massive purging and only 11 of the 250 entities get transmitted. How can I force smaller packets without making the system think that I am updating at 15250FPS?
Server output:
Purging >5 history frames:11
Purging >5 history frames:11
Purging >5 history frames:11
Purging >5 history frames:11
Purging >5 history frames:11
zone update overflow FPS:15250
Purging >5 history frames:11
Purging >5 history frames:11
Purging >5 history frames:11
Purging >5 history frames:11
Purging >5 history frames:11
Code change:
long time = Calendar.getInstance().getTimeInMillis();
@pspeed ok I figured everything out! I added debugging to the client to watch what is happening on the other end. It reports the time delta between received frames and the updates per frame. and modified my server code to use my own Timer to schedule the server tick update interval. Here are my finding:
Test #1
Server tick rate 50ms
Number of entities 1000
Bandwidth used 0.437488 megabits/second
Client output:
endFrame : Update count [541] Milliseconds between frames [49]
endFrame : Update count [459] Milliseconds between frames [0]
endFrame : Update count [541] Milliseconds between frames [49]
endFrame : Update count [459] Milliseconds between frames [0]
endFrame : Update count [541] Milliseconds between frames [51]
endFrame : Update count [459] Milliseconds between frames [1]
endFrame : Update count [541] Milliseconds between frames [49]
endFrame : Update count [459] Milliseconds between frames [0]
endFrame : Update count [541] Milliseconds between frames [50]
endFrame : Update count [459] Milliseconds between frames [0]
Test #2
Server tick rate 50ms
Number of entities 1000
Bandwidth used 0.438184 megabits/second
Client output:
endFrame : Update count [541] Milliseconds between frames [50]
endFrame : Update count [459] Milliseconds between frames [1]
endFrame : Update count [541] Milliseconds between frames [49]
endFrame : Update count [459] Milliseconds between frames [1]
endFrame : Update count [541] Milliseconds between frames [49]
endFrame : Update count [459] Milliseconds between frames [0]
endFrame : Update count [541] Milliseconds between frames [50]
endFrame : Update count [459] Milliseconds between frames [2]
endFrame : Update count [540] Milliseconds between frames [48]
endFrame : Update count [460] Milliseconds between frames [0]
endFrame : Update count [541] Milliseconds between frames [50]
endFrame : Update count [459] Milliseconds between frames [1]
Conclusion:
After in test #2 I kept getting the dreaded “collect underflow FPS:0” it was clearly STILL transmitting at the proper and steady pace. So the collection underflow message is a red haring. When I send server updates from the physic’s engine’s thread via a tick listener the bandwidth goes nuts. When I send updates through my own java.util.Timer set up as a daemon thread EVERYTHING WORKS AS ADVERTISED! Even with one MASSIVE update frame as you can see.
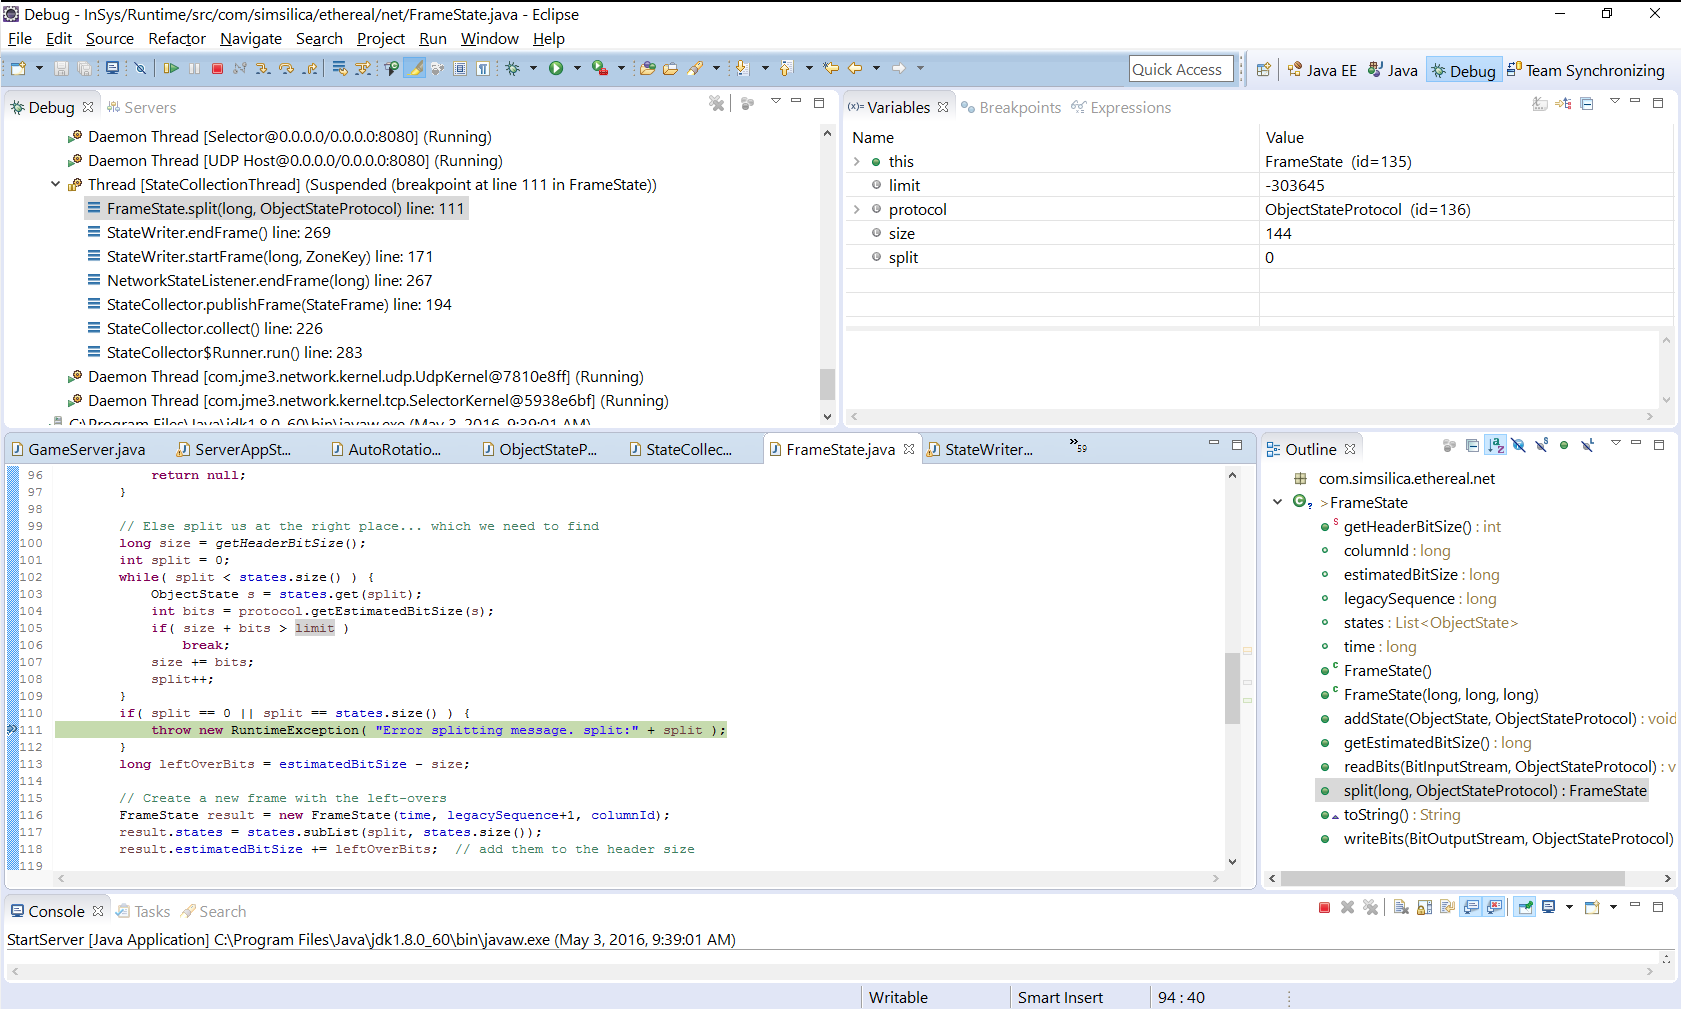
java.lang.RuntimeException: Error splitting message. split:0
at com.simsilica.ethereal.net.FrameState.split(FrameState.java:111)
at com.simsilica.ethereal.net.StateWriter.endFrame(StateWriter.java:269)
at com.simsilica.ethereal.net.StateWriter.flush(StateWriter.java:341)
at com.simsilica.ethereal.NetworkStateListener.endFrameBlock(NetworkStateListener.java:195)
at com.simsilica.ethereal.zone.StateCollector.collect(StateCollector.java:260)
at com.simsilica.ethereal.zone.StateCollector$Runner.run(StateCollector.java:325)