I’ve made a branch with some more changes you can test. I clamped the AO value and the alphaBlend value to make sure they stay between 0.0-1.0 which could fix the issue.
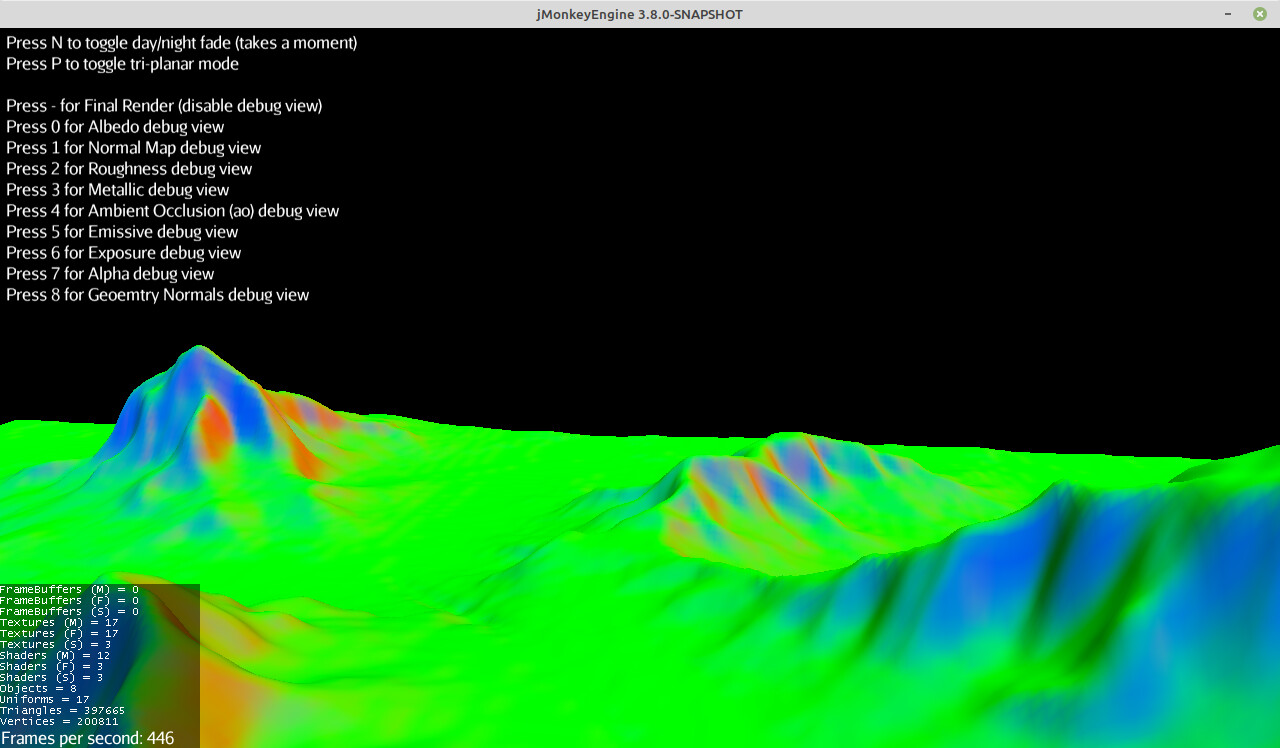
And I also updated the PBRTerrainTest to allow for pressing number keys 0-8 to debug each individual layer, which will be useful for further debugging in case the issue isn’t resolved.
So if you get a chance, let me know if the error still persists when you build this branch and run the PBRTerrainTest example.
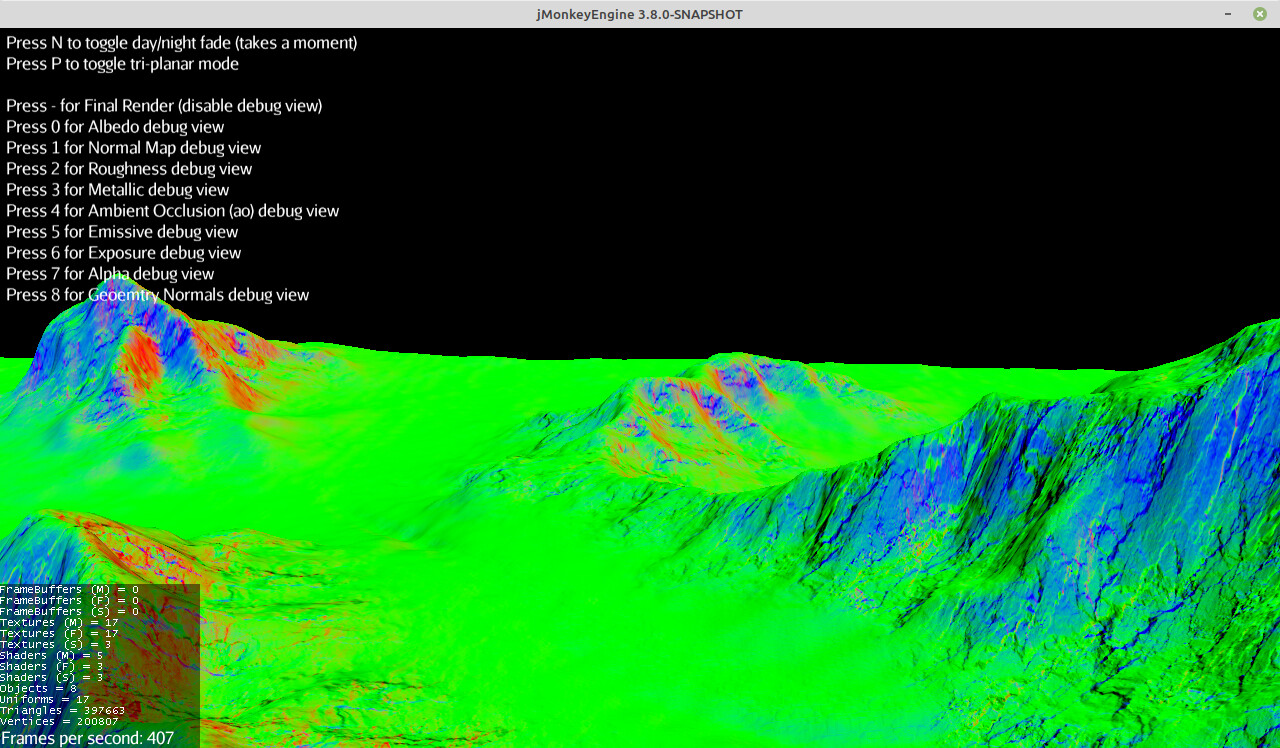
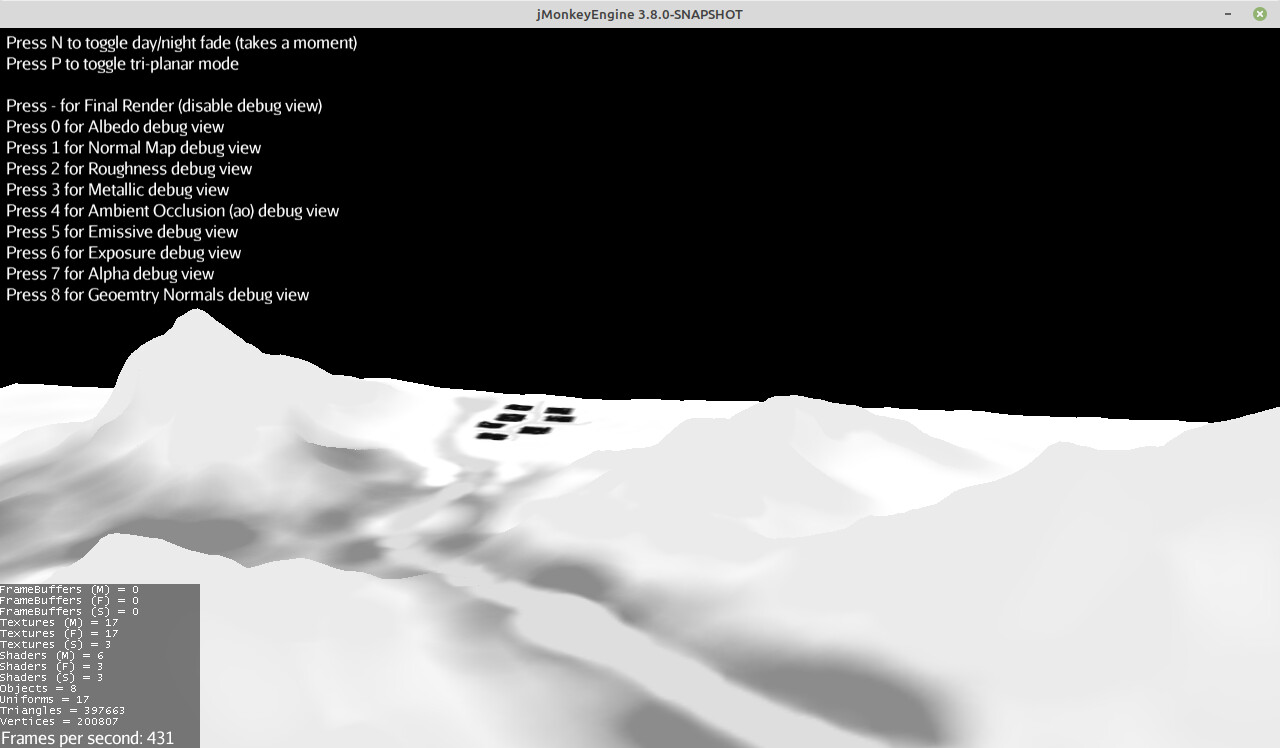
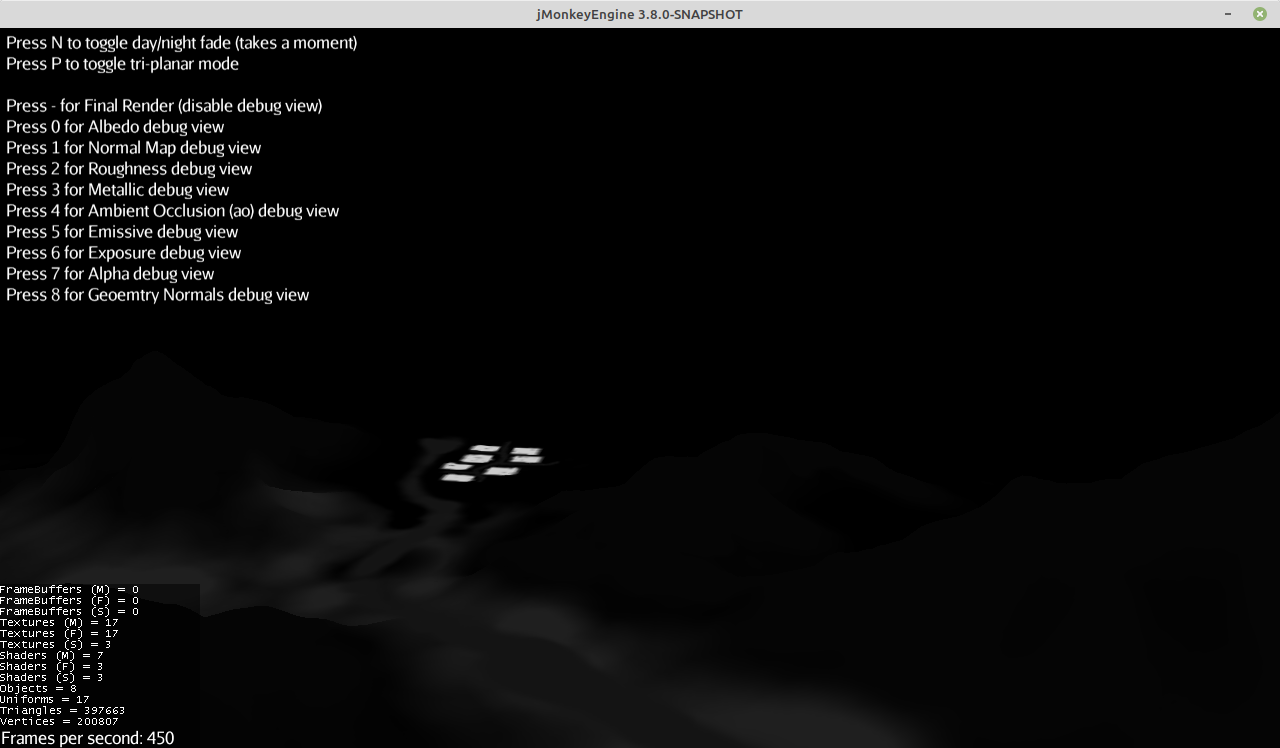
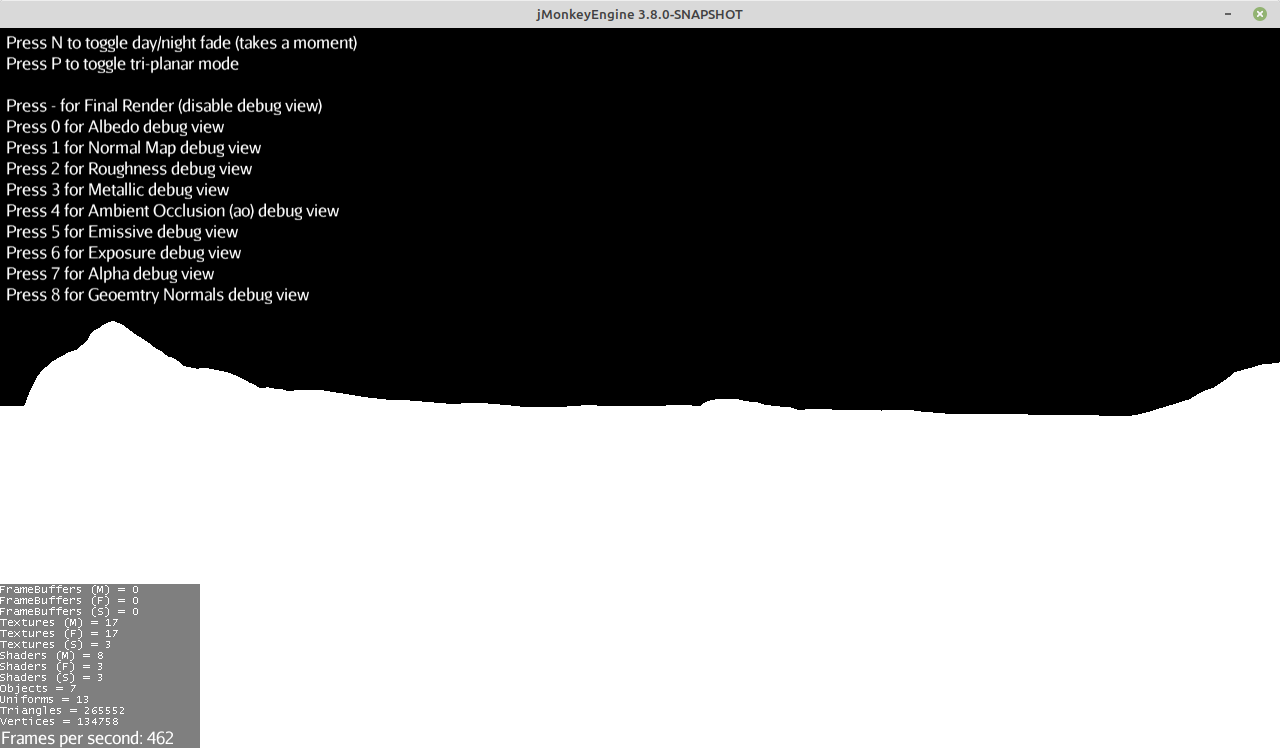
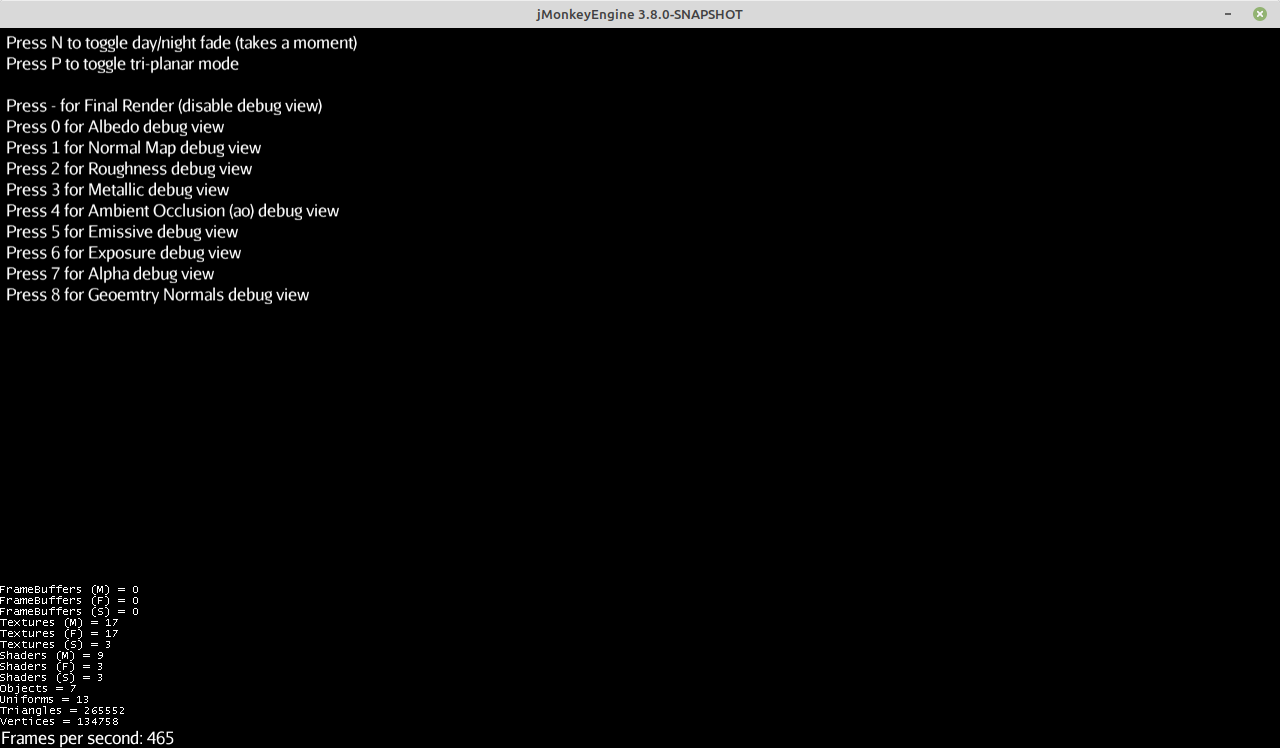
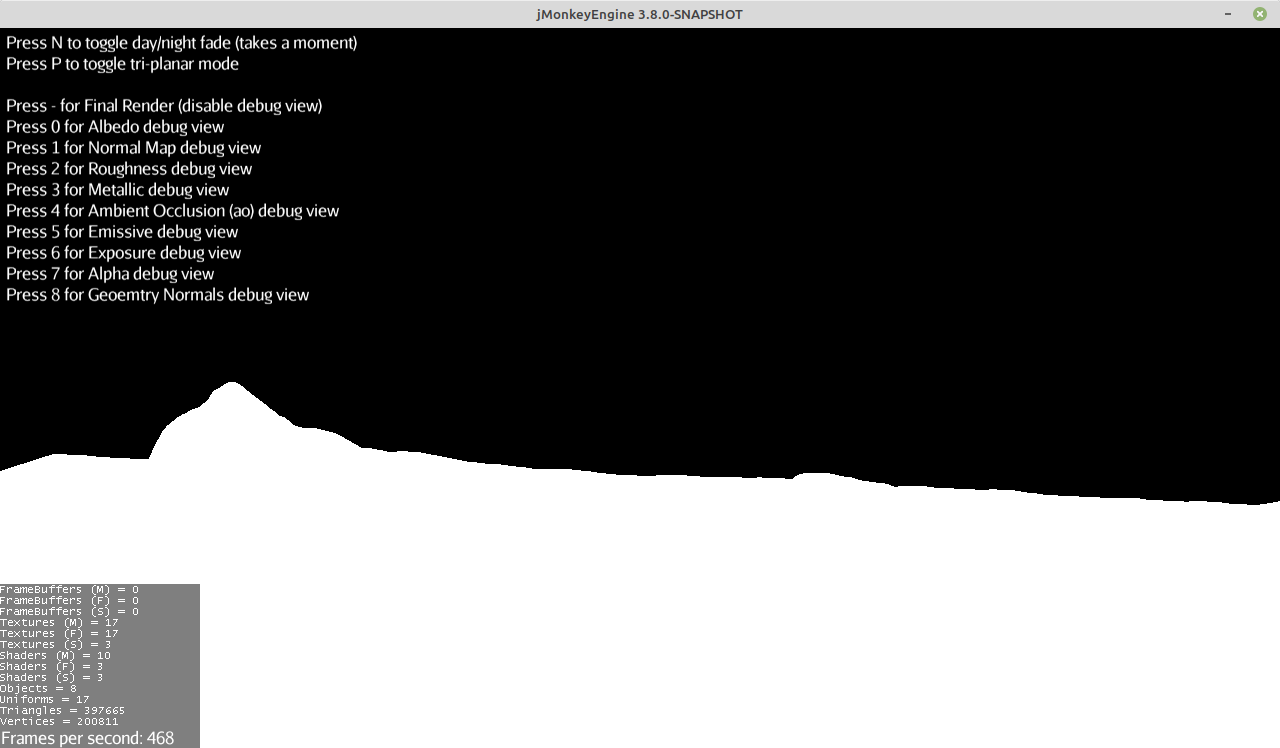
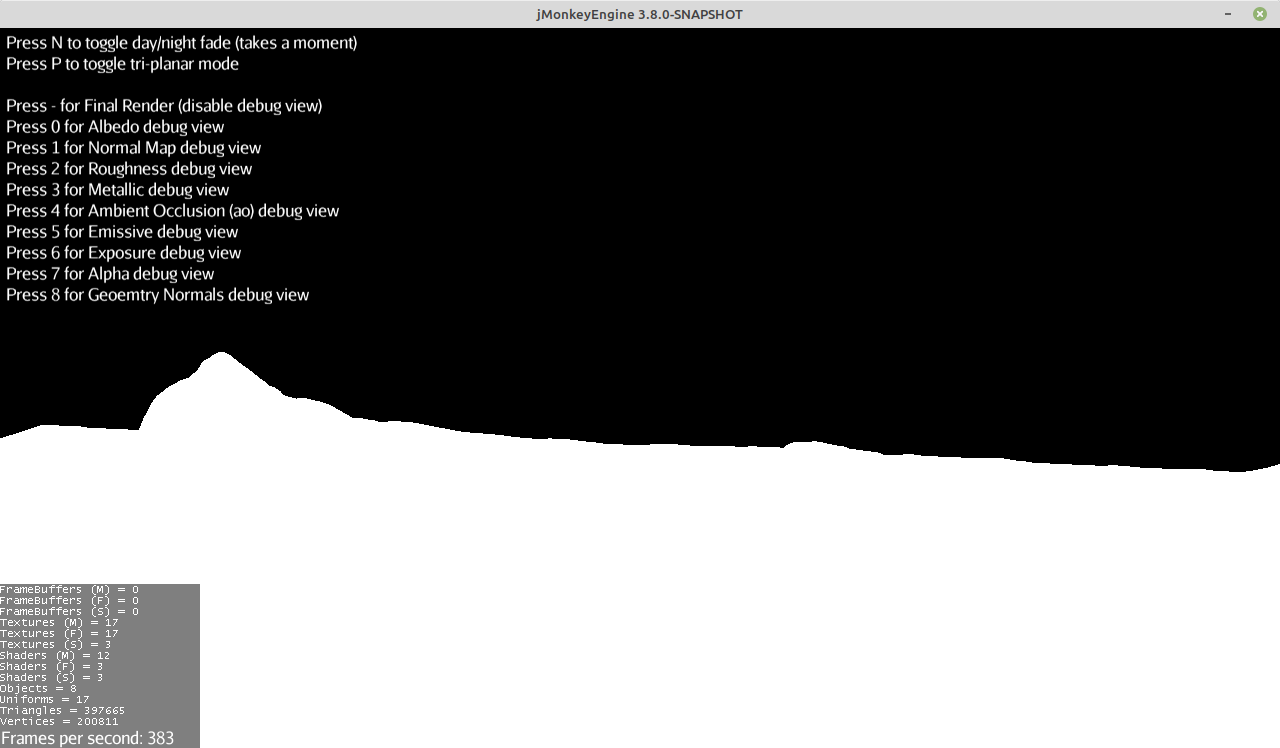
And if it still doesn’t work, then it would be helpful to see a screenshot of what the scene looks like when you press the “0” key to visualize the albedo layer before any lighting happens, as well as the “1” key and “8” key to visualize the normalMaps as well as the geometryNormals. It could also be useful to check all the other layers too, but for the most part every other layer will just be solid black or solid white since the basic PBRTerrain shader only uses albedo and normal maps.
I’m surprised that the debug layers all look correct.
I was expecting to see something distorted with either the albedo or normal debug views.
If all of the debug layers are correct (which appears to be the case) then that means it has to be related to the lighting code.
But the lighting code is identical in PBRTerrain and PBRLighting, so it is strange that this issue would not also occur with PBRLighting.j3md. Especially now that I’ve made them use a shared lighting library as of 3.8
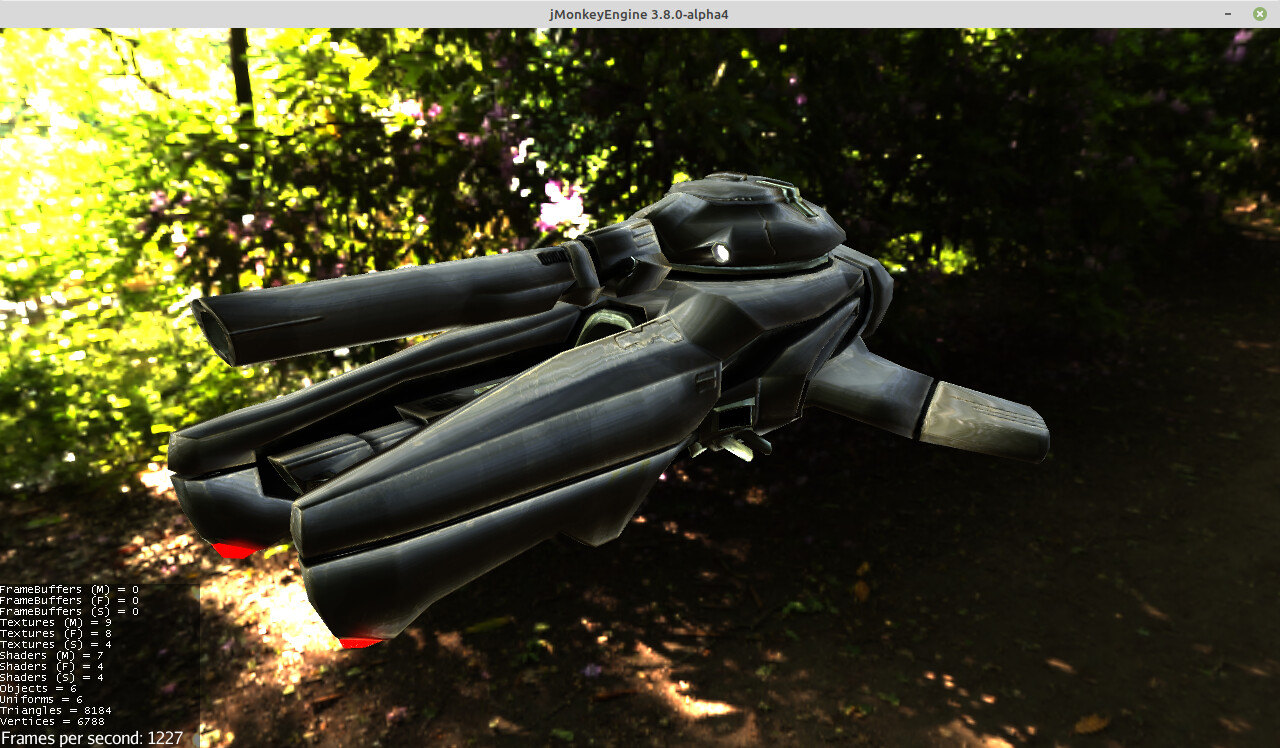
Could you double check that the 3 basic (non terrain) PBRLighting tests are working okay still for you? That would include TestPBRSimple, TestPBRLighting, and TestPBRDirectLighting.
If those all work properly, then the only remaining thing I can think of is that it could be an issue with the light probe being used in the terrain examples. Or maybe the exposure value also needs clamped from 0-1 as well since it works similar to AO and could cause extreme brightness if it gets set over 1.0
Something strange going on with those normal tests.
I am getting this error with the TestPBRSimple and TestPBRLighting.
SEVERE: Uncaught exception thrown in Thread[jME3 Main,6,main]
java.lang.AssertionError: Invalid Vector3f array value null for null
        at com.jme3.renderer.opengl.GLRenderer.updateUniform(GLRenderer.java:1416)
        at com.jme3.renderer.opengl.GLRenderer.updateShaderUniforms(GLRenderer.java:1517)
        at com.jme3.renderer.opengl.GLRenderer.setShader(GLRenderer.java:1759)
        at com.jme3.material.logic.SinglePassAndImageBasedLightingLogic.render(SinglePassAndImageBasedLightingLogic.java:277)
        at com.jme3.material.Technique.render(Technique.java:168)
        at com.jme3.material.Material.render(Material.java:1099)
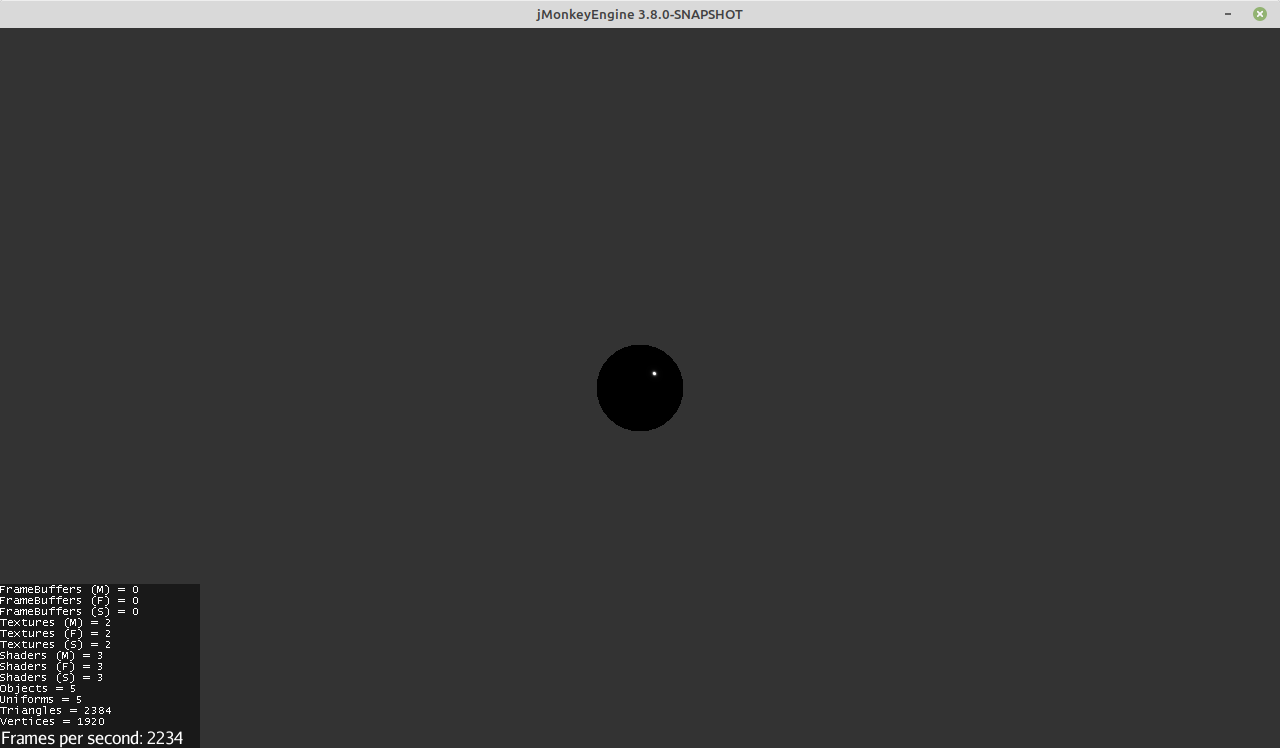
However on the TestPBRDirectLighting I get this image:
It is very strange that this error occurrs on my test branch, but doesn’t occur on 3.8.0-alpha4. I’m not quite sure what to make of this, because there were no changes to anywhere but the internal shader code between these 2 branches, and they were very minor changes to fog and spec gloss. And fog isn’t used in that scene so that shouldn’t have made any difference.
Was this the full exception, or were there any other exceptions thrown before/after it pointing to any shader code?
The only change between 3.8.0-alpha4 and my test branch are changes related to the specGloss code in the .frag shader, but no uniform names or anything were changed so that is a strange error to be getting. I’d expect an error pointing to the fragment shader code, since the only code I changed was in the .frag files, and not even the .j3md files were changed between alpha4 and this test branch.
Are all of these rendering issues only happening on one specific device? It makes me wonder if this isn’t some deeper issue with jme’s rendering engine sending bad data to shaders on certain devices or something, idk. I’m honestly stumped at this point.
The last thing I can think of trying with the PBRTerrain shader is to just mess with the code prior to the lighting calls in the AdvancedPBRTerrain.frag file.
I’d try commenting out all of the texture reads and then let it run with the default vars set to the pbrSurface struct and see what happens. Or try hardcoding some of the pbrSurface’s variables in the shader right before the lighting code, like set surface.albedo to white, and the surface.normal value to something like 0,1,0
I’d also try commenting out the different lines of code in the fragment shader that calculate the different lighting contribution. For example comment out the direcitonalLight contribution, and then the probe contribution and see if its either of those causing the issue.
I’d just keep changing little things like that until you find where exactly the issue is coming from.
edit:
Also it could be worth changing the light probe in the pbr terrain test to use the defaultProbe that is used by the tank test. I know I used a different light probe in the terrain tests, so maybe something is wrong with it.
edit 2:
something else I just read about your gpu said this:
Precision Errors: Intel iGPUs historically have issues with precision qualifiers like highp in fragment shaders, especially in older GLSL code.
So maybe it couuld be worthwhile deleting that code that sets precision qualifiers that we were speculating over in a seperate github issue (or change it to lowp or mediump and see what happens). But I read so much conflicting info on precision qualifiers so this is just a shot in the dark, but still is worth trying.
This is very strange, when I run the TestPBRSimple directly and not through the test dialog, it works perfectly.
I wonder if something with the build process is not getting mixed up.
I wonder if it is due to the fact that it was an assertion exception you encoutnered. I think that assertions may get enabled when running the tests through that test dialog, but are otherwise disabled unless turned on.
It sounds like your integrated gpu may not like that its being forced to use highp for all of these. So I’d try deleting all this code (or changing it from highp to mediump or lowp) and see if the issue goes away maybe. I am not confident that’s the issue, but its worth a shot.
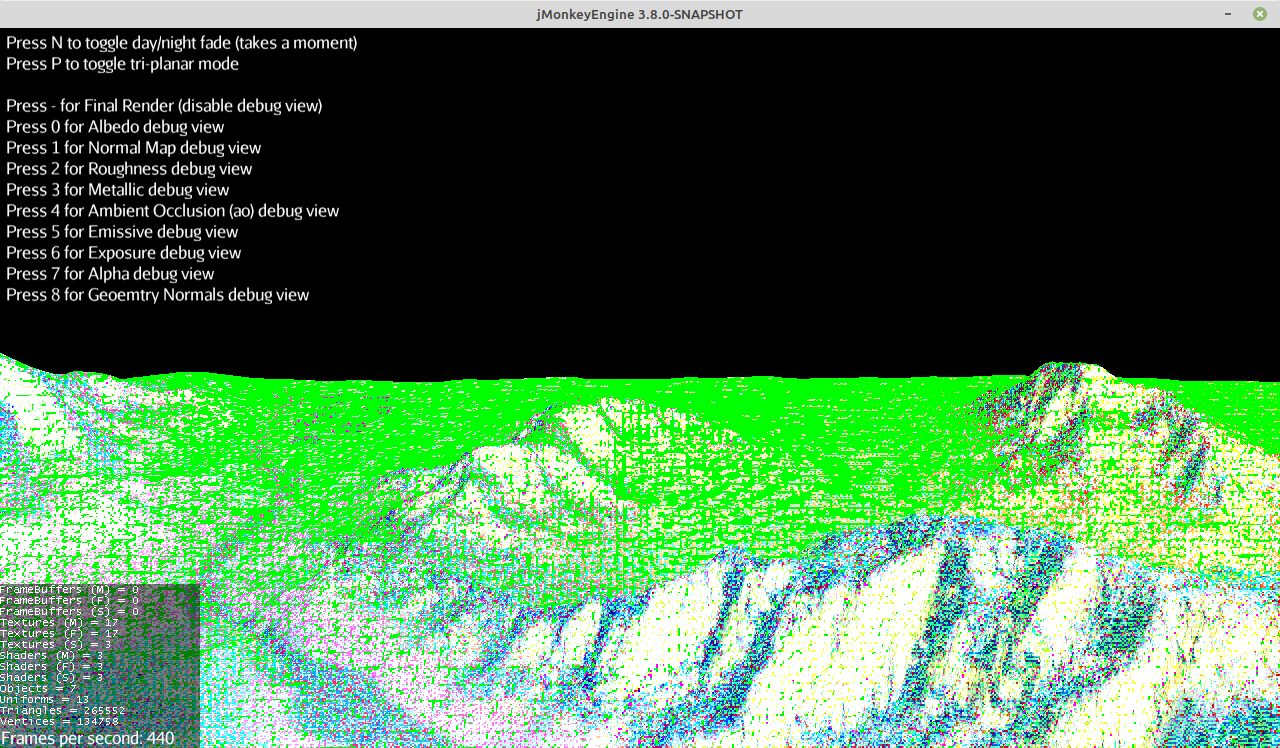
After looking at the screenshots again, I’m noticing that your screenshots make it look like the colors from the geometryNormals layer are showing through in the final render.
And I am thinking this is happening due to some type of memory overflow error that is causing variables in the lighting code to be corrupted once the gpu is low on memory.
The issue also looks like its gotten worse in your most recent screenshot in the latest 3.8 version, which is likely because I upgraded the shaders to have more uniforms and to use the pbr structs in 3.8. All of these changes have made the pbr terrain use even more vram than it did when you originally reported this issue. I recall in your original screenshots, only some textures were messed up, but now they all look distorted.
So reducing the precision of variables could be more likely to solve the issue than I previously thought, if it is indeed an issue with running out of vram.
If not, then it could still be worth removing all but 1 texture layer and see if the reduced memory usage gets things to render okay.
Depending on the space the normals are in, the normal debug view might look strange.
Since i am buying new hardware, and i would like to buy it especially for development i might ditch nvidia after 20 years of a “fanboy” life. On what hardware are these issues present.
As far as I’m aware, this is the only device still having this issue.
The other testers haven’t reported back though, so I’m not entirely sure what other GPUs are still having this issue.
It also sounds like some were having a different issue where the render was black (likely related to variables initialized with null values, which have now all been given defaults and should hopefulyl be fixed)
The geometryNormals and normalMaps debug views appear to be okay on his device, and all of the debug views all match what I see on my device too.
What’s strange is that the normals colors are showing through in the final render, which is why I suspect its a memory overflow issue.
It sounds like this specific integrated intel GPU has very little vram as well (512mb from what I googled) and then it uses system RAM as shared memory, so it may end up just being a case where PBR terrains may not work on some devices with low vram and/or ram, which would be unfortunate. But hopefully I’m wrong about this and a solution can still be found. Maybe some settings juts need tweaked in the device to allow the GPU to use more system RAM, but I’ve never had a device like this so I’m juts speculating based on google searches I’m reading from people who have had simliar issues with intel integrated GPUs.
I tried looking in jme’s build output logs on github, however I can’t seem to find what you are referring to. I did a ctrl-f search for “mesa” in the build output to search for any mesa renderer related information, but I did not find anything.
Could you elaborate on what you are specifically saying to check?
I am still without pc and i am not browsing code on the phone. I should get the remaining parts on monday. So i might be more help once i have everything running.
I was hoping that we can at least reproduce the wrong rendering on the ci renderer that does the screenshot testing. Even if it is a slow process it would allow working on the problem without the hardware that causes the issue