Resource impact of jme3

Hi,

my desktop-pc is a bit old - its an phenom with 4 cores with variable clock between 800 and 3700 MHz.
my graphic card is a Quadro P620.
On my daily work, processor fan is out, so my system is pretty silent.
That does not change on developing/testing my app.


Total system load is 28% and my app takes 2% of it.

Situation changes, when I enable jme3 for the preview.
Default testcase has about 200 lines (mesh-objects), which I consider a very low number of elements.

I use SimpleApplication without any specialities. No sound.

But …


… System load rises over 50% where my app with jme3 takes 26% now.

This time, the cores run at higher frequency, the fan runs at topspeed, no more silent system.

What can I do, to reduce resource impact of jme3?
I don’t know, what causes that high cpu load.
If it depends on the framerate - I don’t need high frame rates.
jme3-graphics will change only at mousebutton pressed, or turning the mouse wheel …

1 Like

One thing you can do is enable VSync in your app settings - this will lock jME’s update rate to your monitor’s refresh rate (typically 60 Hz), so jME doesn’t waste any resources updating frames that will never be seen.

If this makes no difference, there may be a bug (or unexpected feature? :wink:) in your code chewing through CPU - a profiler will help you locate and eliminate it.

2 Likes

Hi Daniel,

thank you for your attention!
According to AppSettings VSync is already enabled by default - and I did not change it.

So might be another “unexpected feature” (like this - LOL)

2 Likes

Hi Daniel,

I followed your advice and run a profiler.


I’m sorry for the ugly font, but that’s what JProfiler offers for free :frowning:
What a shame!

Anyway - using a magnifier, I could identify ALAudioRenderer.run as the most active thread and this is the source of the high cpu load.

Can I turn off audioprocessing? Don’t need it at all.

2 Likes

https://javadoc.jmonkeyengine.org/v3.3.2-stable/com/jme3/system/AppSettings.html#setAudioRenderer-java.lang.String-

…set it to null I think. Before you start your app.

I’ve never done it but I know there is a way and I think that’s it.

1 Like

If you don’t mind opening a bug ticket on GitHub, I think that would helpful - I’ve not heard of others having this issue before, so it would be nice to have a record of it in case it occurs again.

1 Like

Are you using lwjgl2?

Doesn’t the jme lwjgl 2 audio renderer use openal-soft 1.15?

By default, the app runs with some frame rate.
If you’d like to update the application on demand, then:
In update loop you can implement that. How?
Use an Object.wait, notify methods and synchronization. In short, you wait in update method and use notify on mouse event.
This approach is pretty straightforward, when using an offscreen buffer to do the rendering to, then u can copy the result to a BufferedImage and have as many windows as u’d like as well and AWT can be used for event handling.
To use the approach with jme input system, some extra though would have to be put into it - since I think jme input is done in the same thread as update loop.
Another approach would be to skip rendering the frame if no update have been done - eg override SimpleApplication.update method and call super.update only when change occured.

Actually, if you read the thread he describes that the audio layer is taking an unusual amount of time doing nothing.

I don’t think he’s looking to generate screens on demand… just to have 60 hz of a simple scene operate at something less than 30% CPU. A reasonable request, in my opinion.

Still waiting to hear if nulling the audio renderer fixes the issue.

To be precise - the cpu-load was during the whole app doing nothing at all. No user interaction, no graphic processing, no of anything.
The second red bar from the top is my background-timer, that runs every 100ms which executes some native code to read shared memory and update user-display (the swing part, not the jme3-part).

Sorry - don’t know, why I did not receive any notification mails. Got them before and was happy about notification.

I’m sad to answer: NO.

But let’s tell the whole story:
I read about AppSettings in javadoc - so as I followed Awt-Sample I found AppSettings in the Swing-Panel and added setAudioRenderer(null) there.
Nothing changed - which means, AudioRenderer starts anyway …

So I thought: may be, that setting-change comes too late and verified, that at execution time of constructor of SimpleApplication there is no AppSettings set.
Then I created AppSettings there and set AudioRenderer to null.

Next letdown - no changes - or better said: AudioRenderer starts bloating cpu again …

So I thought, if I can’t avoid to start AudioRenderer, let’s try to kill it.
I added a audioRenderer.cleanup() and a AudioContext.setAudioRenderer(null)
… but that provokes an Exception from checkThread, which can’t be captured.

So if run out of ideas too, I’m about to subclass LegacyApp and try to clone SimpleApplication without Audio.

I have to confess, that I don’t know, how to do that.

@The_Leo
Your post sounds very interesting - although I did not understand anything. But stopping jme3-update and use awt-eventsystem - YES - would like and appreciate it a lot.
If that’s possible, please translate your words in noob speech :wink:

You set the appsettings before calling start().

Check the wiki for more info.

Some logs from startup:

WARNING: An illegal reflective access operation has occurred
WARNING: Illegal reflective access by com.jme3.util.ReflectionAllocator (file:/d/java/SR/UI4LinuxCNC/lib/jme3-core.jar) to method sun.nio.ch.DirectBuffer.cleaner()
WARNING: Please consider reporting this to the maintainers of com.jme3.util.ReflectionAllocator
WARNING: Use --illegal-access=warn to enable warnings of further illegal reflective access operations
WARNING: All illegal access operations will be denied in a future release
INFORMATION GLRenderer 16:17:10 OpenGL Renderer Information
 * Vendor: NVIDIA Corporation
 * Renderer: Quadro P620/PCIe/SSE2
 * OpenGL Version: 4.6.0 NVIDIA 418.113
 * GLSL Version: 4.60 NVIDIA
 * Profile: Compatibility
INFORMATION LwjglContext 16:17:10 LWJGL 2.9.3 context running on thread jME3 Main
 * Graphics Adapter: null
 * Driver Version: null
 * Scaling Factor: 1
INFORMATION ALAudioRenderer 16:17:11 Audio Renderer Information
 * Device: OpenAL Soft
 * Vendor: OpenAL Community
 * Renderer: OpenAL Soft
 * Version: 1.1 ALSOFT 1.15.1
 * Supported channels: 64
 * ALC extensions: ALC_ENUMERATE_ALL_EXT ALC_ENUMERATION_EXT ALC_EXT_CAPTURE ALC_EXT_DEDICATED ALC_EXT_disconnect ALC_EXT_EFX ALC_EXT_thread_local_context ALC_SOFT_loopback
 * AL extensions: AL_EXT_ALAW AL_EXT_DOUBLE AL_EXT_EXPONENT_DISTANCE AL_EXT_FLOAT32 AL_EXT_IMA4 AL_EXT_LINEAR_DISTANCE AL_EXT_MCFORMATS AL_EXT_MULAW AL_EXT_MULAW_MCFORMATS AL_EXT_OFFSET AL_EXT_source_distance_model AL_LOKI_quadriphonic AL_SOFT_buffer_samples AL_SOFT_buffer_sub_data AL_SOFTX_deferred_updates AL_SOFT_direct_channels AL_SOFT_loop_points AL_SOFT_source_latency
WARNUNG ALAudioRenderer 16:17:11 Pausing audio device not supported.
INFORMATION ALAudioRenderer 16:17:11 Audio effect extension version: 1.0
INFORMATION ALAudioRenderer 16:17:11 Audio max auxiliary sends: 4

Sure - constructor has to be executed before calling start()

I’m not saying that the openal-soft version is the problem… but it’s possible it could be part of it. Do you still have the problem when using lwjgl3 instead?

Are you sure you set it correctly? I just tested it and setting settings.setAudioRenderer(null); does not spit out the AudioRenderer info when starting the application. I did not look further into the code, but the fact that you still have the log output might indicate that you did not disable the AudioRenderer correctly as paul mentioned.

edit:
I just looked into the code, it should not initialize it if you set it to null:

Given the rest of the thread, my guess is that OP didn’t set the app settings up right. Going to have to see some source code, I think.

Ok, I’ll start with run() of my Swing-App (jme3 comes later):

public void run() {
      while (!statusReader.isInitializationCompleted()) {
         try {
            Thread.sleep(10);
         } catch (InterruptedException e) {
            e.printStackTrace();
         }
      }
      try {
         LCStatus.getStatus().getSetup().parseIniFile(iniFile.getAbsolutePath());
      } catch (Throwable t) {
         throw new RuntimeException("no Config! - Is linuxcnc running?", t);
      }
      jme3App = new Preview3DCreator();
      jme3App.setGeoParser(new RS274Reader());
      exportHandlers = findExportHandlers(exportHandlerDir);
      paneStack      = PaneStack.getInstance(cmdWriter, errorReader);

...
}

jme3App is a member-variable of my application.
paneStack holds the different application panels (like a notebook without notebook tabs). One of them has a JSplitPane and in one of the parts, jme3-Window will be shown.

Here comes the constructor of the Pane, that holds jme3-display:

   public JME3Pane(SimpleApplication app) {
      JME3Pane.app = app;

      app.setPauseOnLostFocus(false);
      app.createCanvas();
      app.startCanvas();

      context = (JmeCanvasContext) app.getContext();
      canvas  = context.getCanvas();
      //      canvas.setSize(app.getWidth(), app.getHeight());
      setLayout(new BorderLayout());
      add(canvas, BorderLayout.CENTER);
   }

So here I use startCanvas() - there’s no (other) start of SimpleApplication.

Finally here the Constructor of my descendant of SimpleApplication:

   public Preview3DCreator() {
      geoCache = new HashMap<Integer, Geometry>();
      useYZ    = true;
      AppSettings settings = new AppSettings(true);

      settings.setWidth(1000);
      settings.setHeight(1000);
      settings.setAudioRenderer(null);
      settings.setResizable(true);
      this.setSettings(settings);
   }

When you look at the first source - constructor of my SimpleApplication runs before the construtor of JME3Pane, so settings.setAudioRenderer should come before execution of startCanvas().

Hi,

I did a last test:

  public Preview3DCreator() {
      geoCache = new HashMap<Integer, Geometry>();
      useYZ    = true;
      AppSettings settings = new AppSettings(true);

      settings.setWidth(1000);
      settings.setHeight(1000);
      log.log(Level.INFO, "audioRenderer[0]: " + settings.getAudioRenderer());
      settings.setAudioRenderer(null);
      log.log(Level.INFO, "audioRenderer[1]: " + settings.getAudioRenderer());
      settings.setResizable(true);
      this.setSettings(settings);
   }

which results in these logs:

INFORMATION Preview3DCreator 04:17:39 audioRenderer[0]: LWJGL
INFORMATION Preview3DCreator 04:17:39 audioRenderer[1]: null
INFORMATION JmeDesktopSystem 04:17:41 Running on jMonkeyEngine 3.3.2-stable
 * Branch: HEAD
 * Git Hash: 1a05e3f
 * Build Date: 2020-04-27

from reading LegacyApplication AudioRenderer may not be started from Application.start() - but I suspect that some lowlevel-code creates the AudioRenderer without respecting the AppSettings.

The point is - I have lot of initialization stuff, parse the geom-sources, load about 200 primitives and when I’m done with all that, than logs from AlAudioRenderer creation appear.

Hi,

have to report about the solution.

My fault was, that I had two classes with the same name in testing and source - and of cause, I changed the wrong one.
Took me lots of log-entries to get rid of the testclass, which I already had forgotten.

After renaming the testclass and changing the right one it shows, that constructor of SimpleApplications child is the right place for AppSettings. Even setup after constructor from JPanel works, but …

… starting without audio did not change anything. Stil about 30% cpu load. So I looked for a profiler, that I can read without magnifiers …
I read, that netbeans has a profiler integrated …

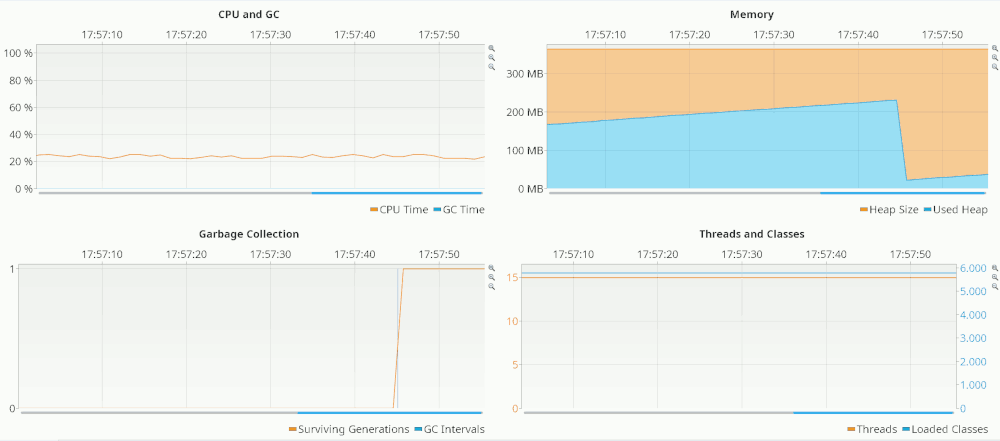
I was astonished about the rising memory consumption. I thought, that everything should be idle …
Then I looked at my timer thread and realized the plenty stack objects and the overall usage of quoted strings …

So I started to change things. Convert stack variables to members, made functions synchronized, convert strings into static constants …
Had to touch nearly every class …

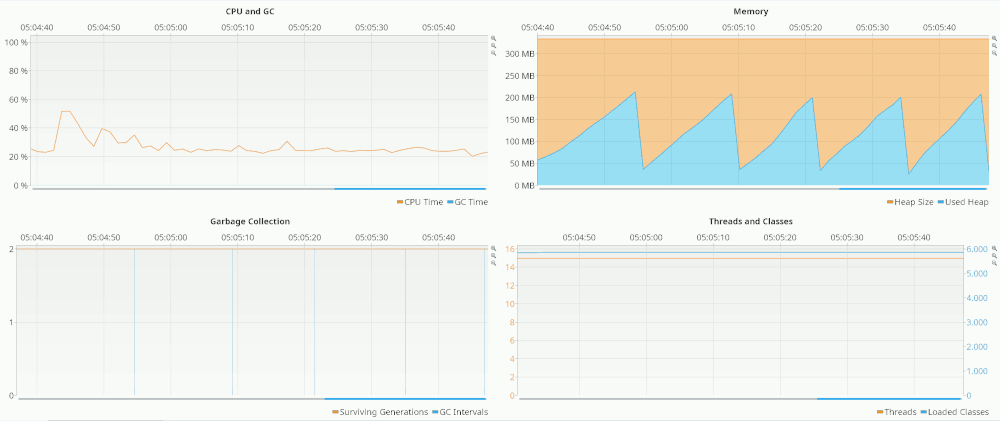
… and was shocked after the first run after the “optimization”:

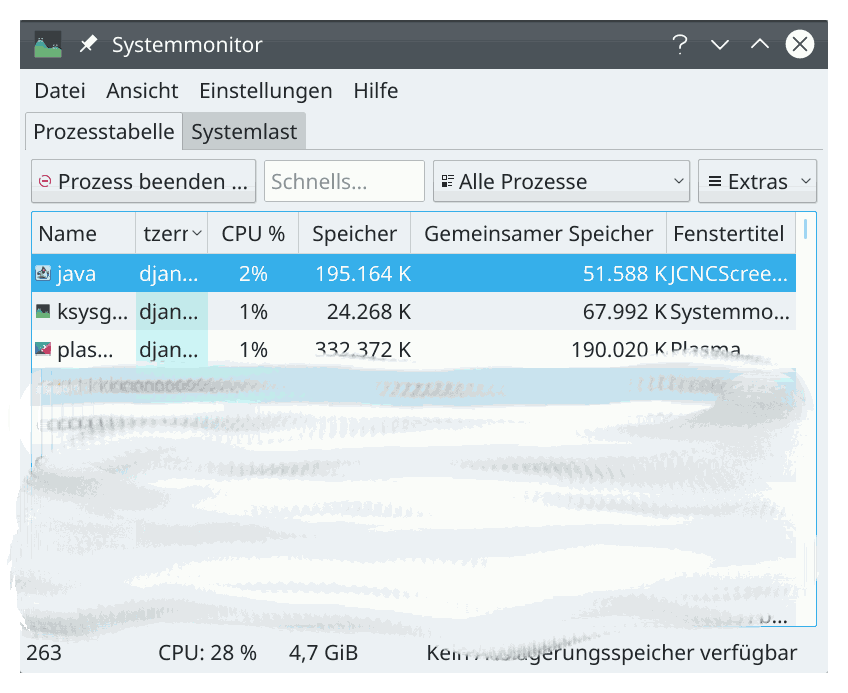
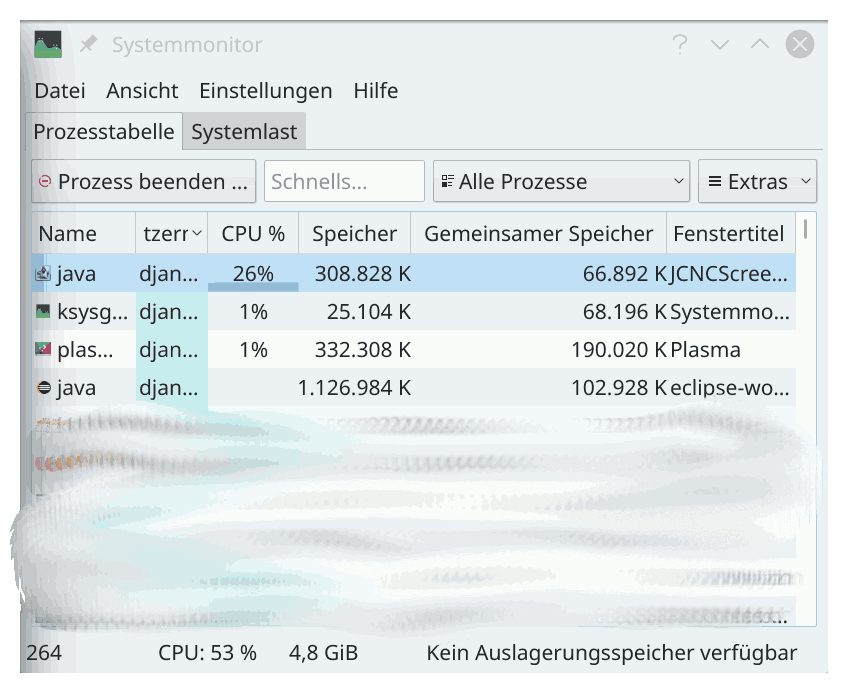
For me this looks quite worse than first picture. But linux system-monitor says the opposite is true. The ugly picture now causes a system load of about 4% (with jme3 active!), whereas the smart one consumed about 30% (at higher cpu-clock)

I don’t really understand that. Without jme my app took about 4% - may be my memory wasting was close below the limit and with jme I hit the limit for higher cpu request.
Now with reworked code, I’m way below the limit and stay below the limit with jme activated.
That’s the only way, I can interpret my observations.

What stil causes pain in the head is the rising memory consumption.
Diagram from neatbeans is misleading here. It suggests, that gc cleares the memory to always the same level.
But linux-systemmonitor tells a different story. After short runtime, my app has doubled the memory consumption. Leaving the app idle for some time, stil raises the used memory.
But I have no idea how to get rid of this.
Sadly the profiler does not tell the creator of the objects.

I think, that memory consumption could be a problem at estimated runtimes of 24h or more - don’t know, when the app will run out of memory.

Would like to hear your thoughts/impressions.

You have to understand how the Java memory reservation works. You are probably not using any memory / JVM flags, just the default behavior. That means that your app will make an initial reservation of memory (this is what you see in the task manager). This might increase when the app is running, if it is bounded, the amount of GCs will increase. All this still don’t mean much, depends on how frequently the GC needs to run that does it cause any problems to you.

Inside that memory reservation this real memory usage does what the jVisualVM graph shows you. That looks healthy. If it always returns to the previous level after GC, you are not leaking any memory. To me that just looks fine memory wise.

You can use the flags to put boundaries to the memory if you like. Then to uneducated people it will look nicer as it doesn’t try to use all memory. Just find a limit where it can still work nicely without the GC activity coming a problem.

Netbeans & your system monitor are both telling the truth. :wink: The JVM allocates memory in large chunks and keeps them around. All heap-allocated objects are allocated from these chunks, and this is what your memory profiler is showing - the blue is how much memory from these blocks is in use, and the orange is how much memory the JVM has allocated from the OS. The difference between the lines is how much memory the JVM has already allocated but has free. The OS, of course, has no knowledge of what the JVM is doing with its heap, the memory you see in your system monitor is the same as the orange line (maybe a little higher, if the orange line doesn’t account for JVM overhead that’s not in the Java heap). The JVM always tries to keep enough heap available that it can allocate from the OS without slowing its own program down, so it intentionally tries to keep more than it is using. If it has lots of extra free memory, after some time it will return some of that memory to the OS, but it waits a while to see if its likely to be needed soon or not. Regardless, the JVM has a parameter ( -Xmx ) for the maximum heap space that it will allocate - once that limit is reached, it will never allocate more from the OS, and if the program tries to allocate more than the GC can keep free the program will throw an OutOfMemoryException.

You can get a feel for where memory use is coming from by taking a heap dump and exploring it - you can see memory use by thread and by class, and you can see which threads/classes hold references to specific classes too.

Regarding your optimizations, the first graph is not bad at all for a JVM program (it’s actually remarkably good!). The second is a bit worse, but ultimately “good” and “bad” depends on how hard the GC is working. In both screenshots, the GC is spending barely any time at all (the flat blue line across the bottom of the CPU monitor). Many of the JVM’s GCs are generational collectors, optimized for many short-lived objects being allocated - so objects that are created and then immediately (or shortly) thrown away are almost free. Objects that stick around for longer can cause the GC to do a little more work, but even then the GCs are optimized for very, very heavy workloads. It’s difficult (under most uses) to cause a modern JVM GC to strain much at all.

1 Like