Speed Question - [CLOSED]

I have a game i’ve been working on for 3 years. It is an old 1980’s game that I’m remaking called “Alternate Reality” and about a year ago I started to think i would like to use an engine instead of keep doing my own engine. I have the game 95% completed in my own engine. Or at least the 1st module. The game had 2 modules released.

The game was released on an 8bit Atari machine, and then was release on a 16bit (Atari, Amiga) and then the 8-bit Dungeon came out (2nd module). So I’ve spent time recreating the game to play like the original and through settings you have options to play a more enhanced version.

When I decided to look at an engine, I ended up liking JME and I did a small test case and it worked out. My game is in a 3d world but basically 2d quads every where. More like Doom, even though this game was before Doom by years.

So I created a TimePilot 2d game, but in a 3D world using Quads for the graphics and it worked out great.

So Now, I started working on converting my game to JME, and I"m about 90% complete converting it. I finally got it up under JME and was blow away.
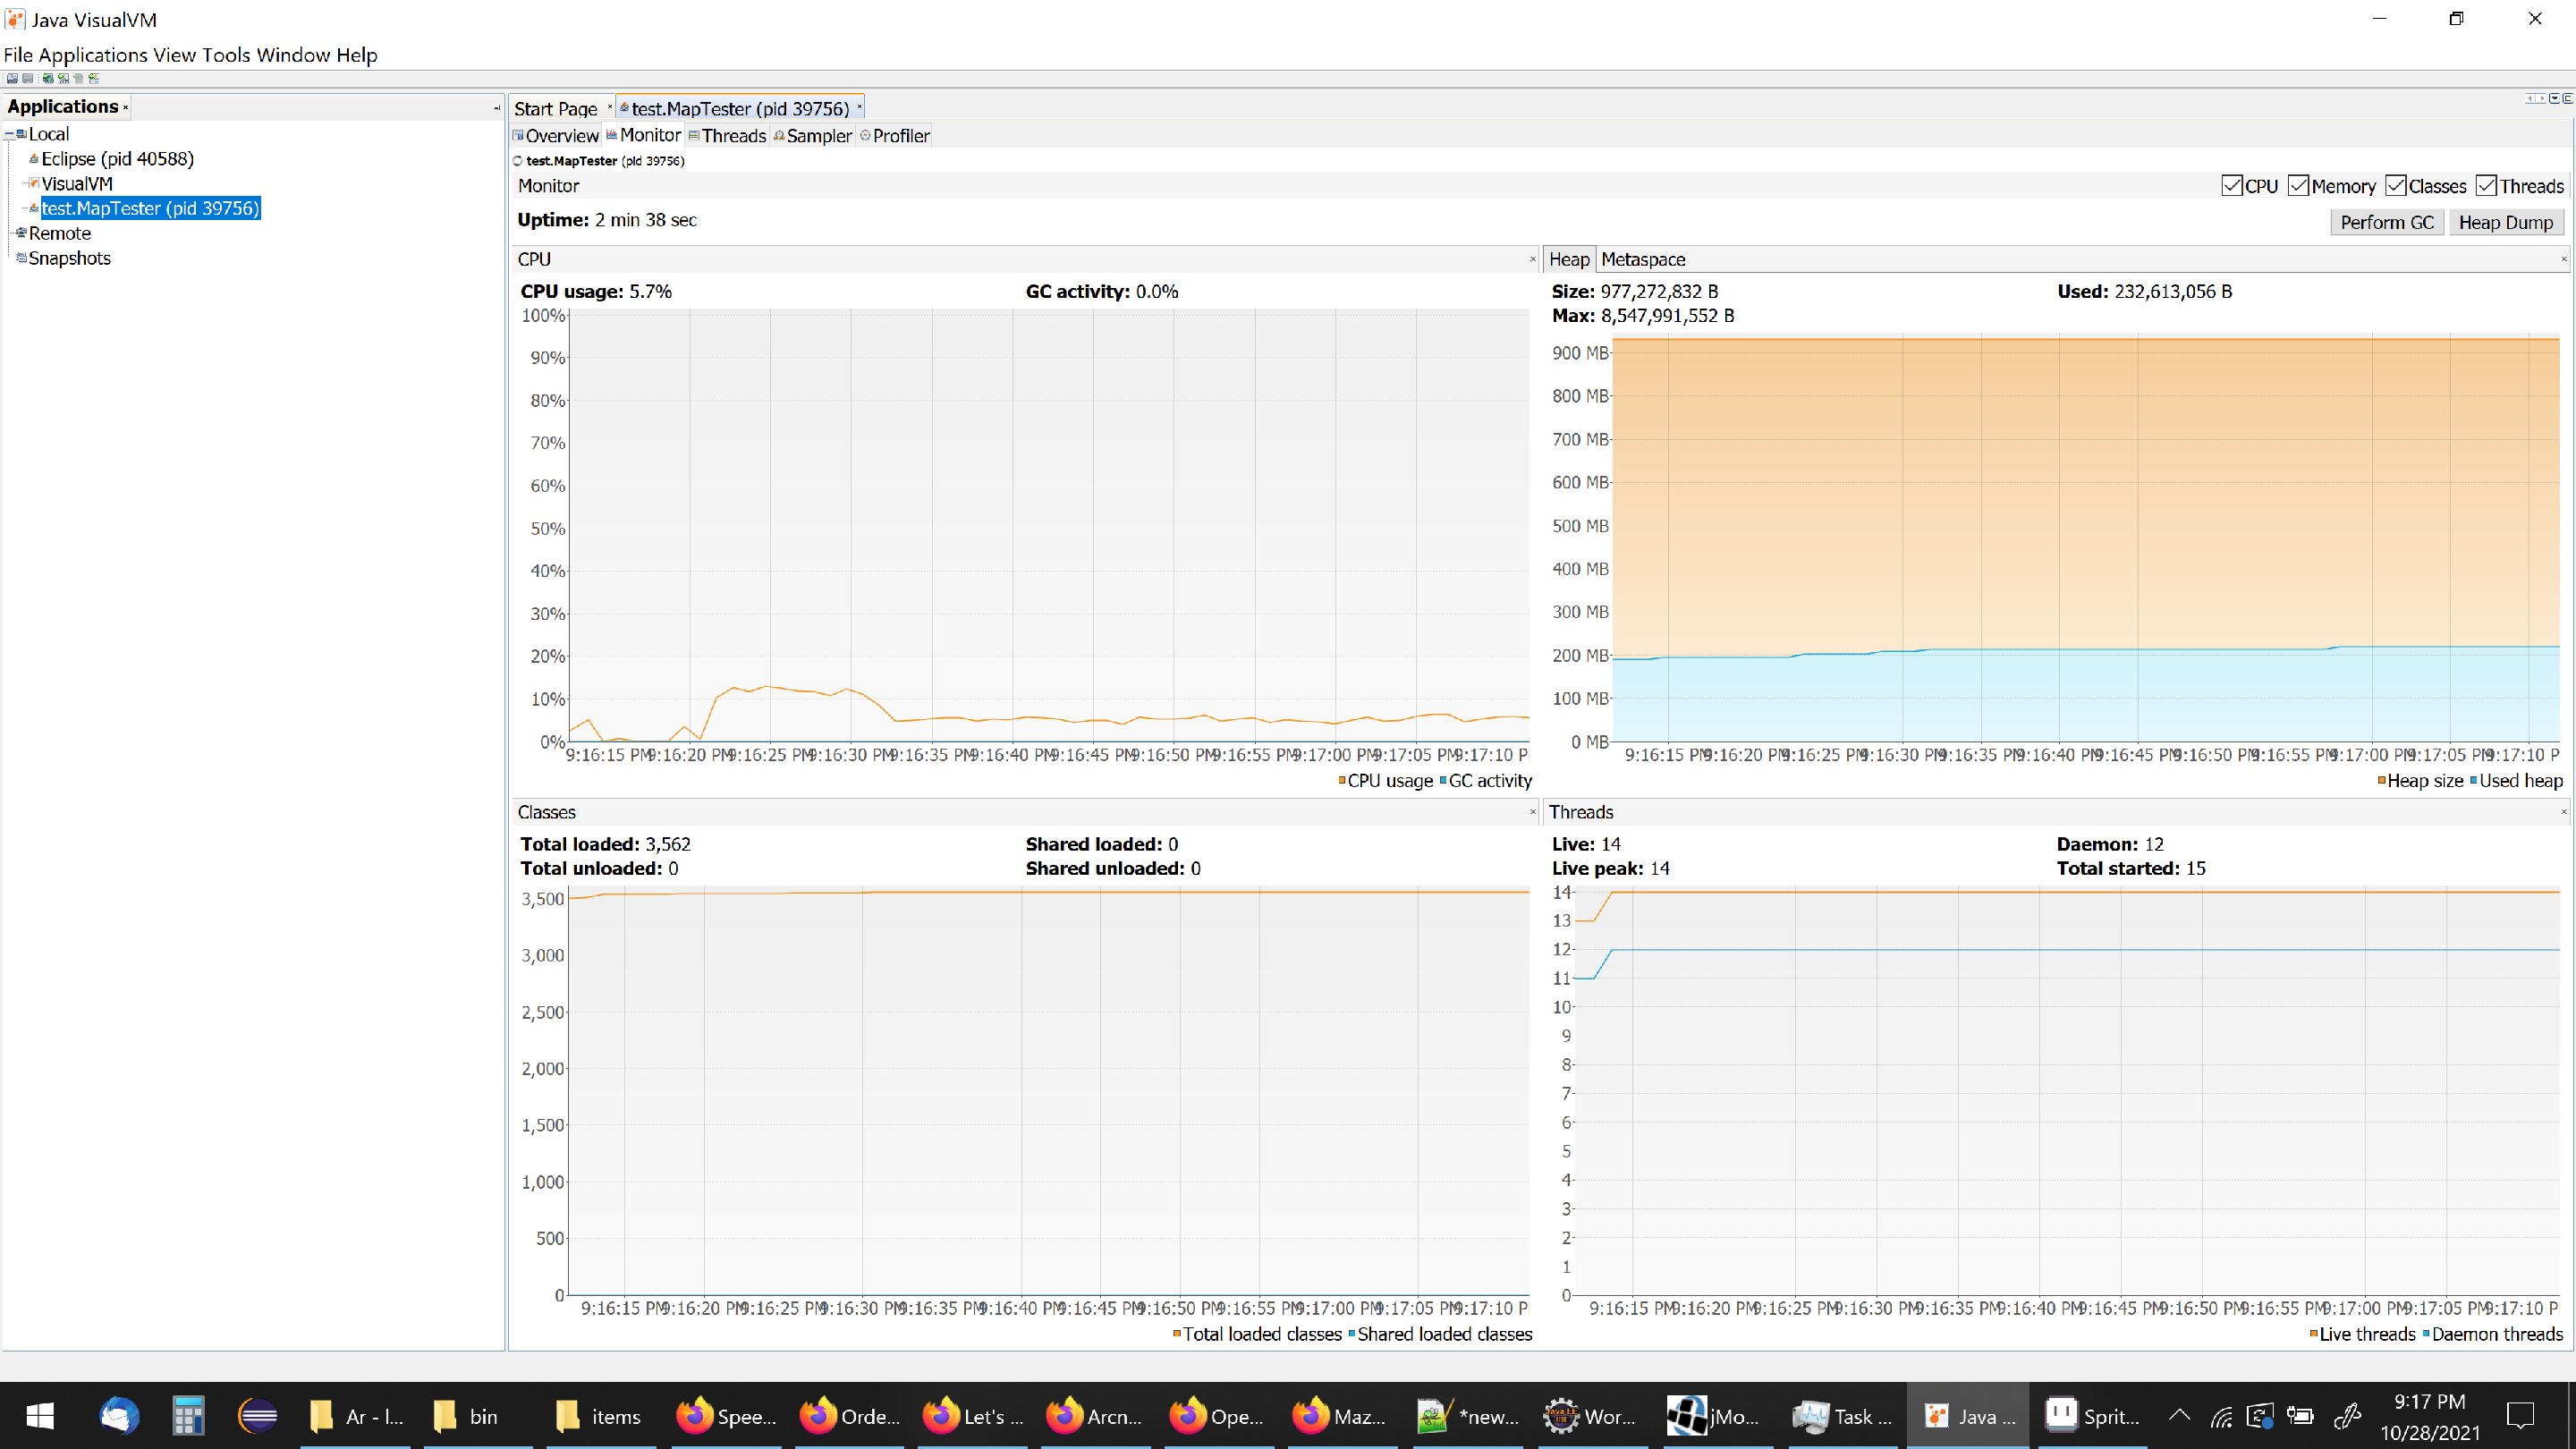
The Frame rate was 15FPS.

So I then just started a simple test project and all it is a 64x64 grid based map with Quads. Only about 30 different textures and 30 different materials. I use the same material over and over since so many walls are the same texture.

image
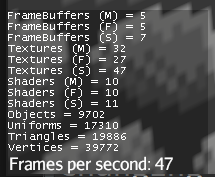
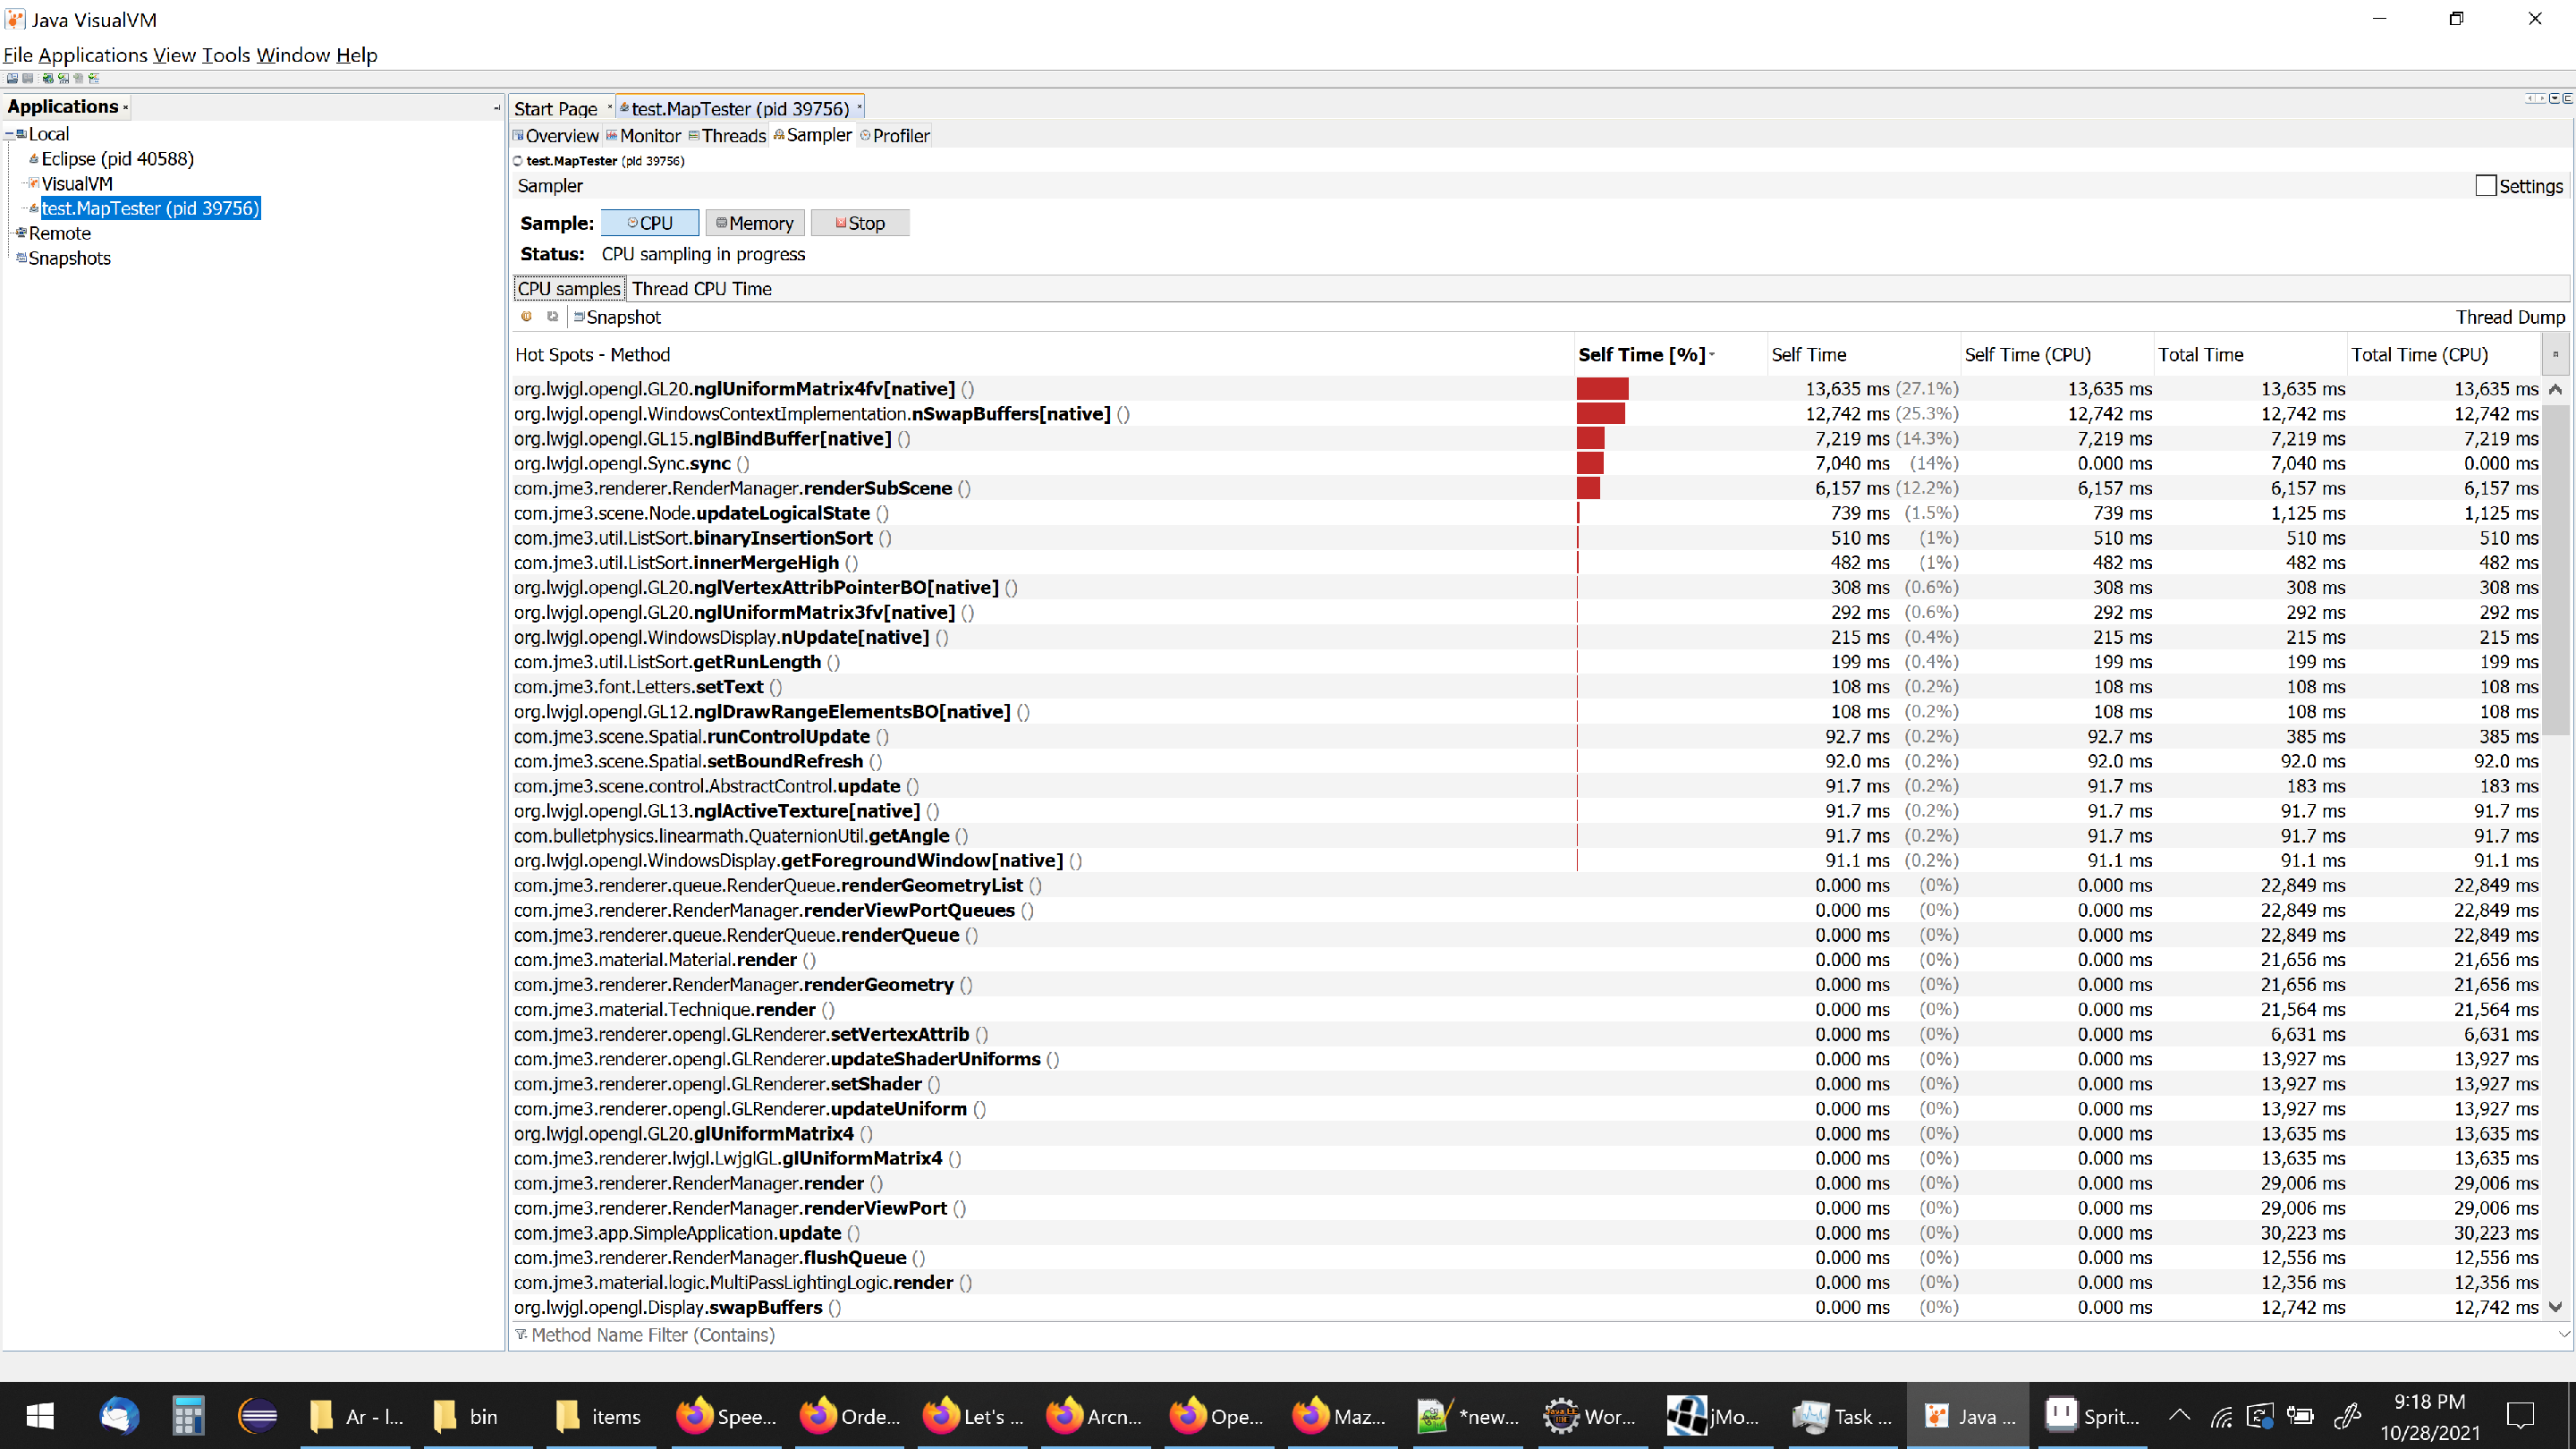
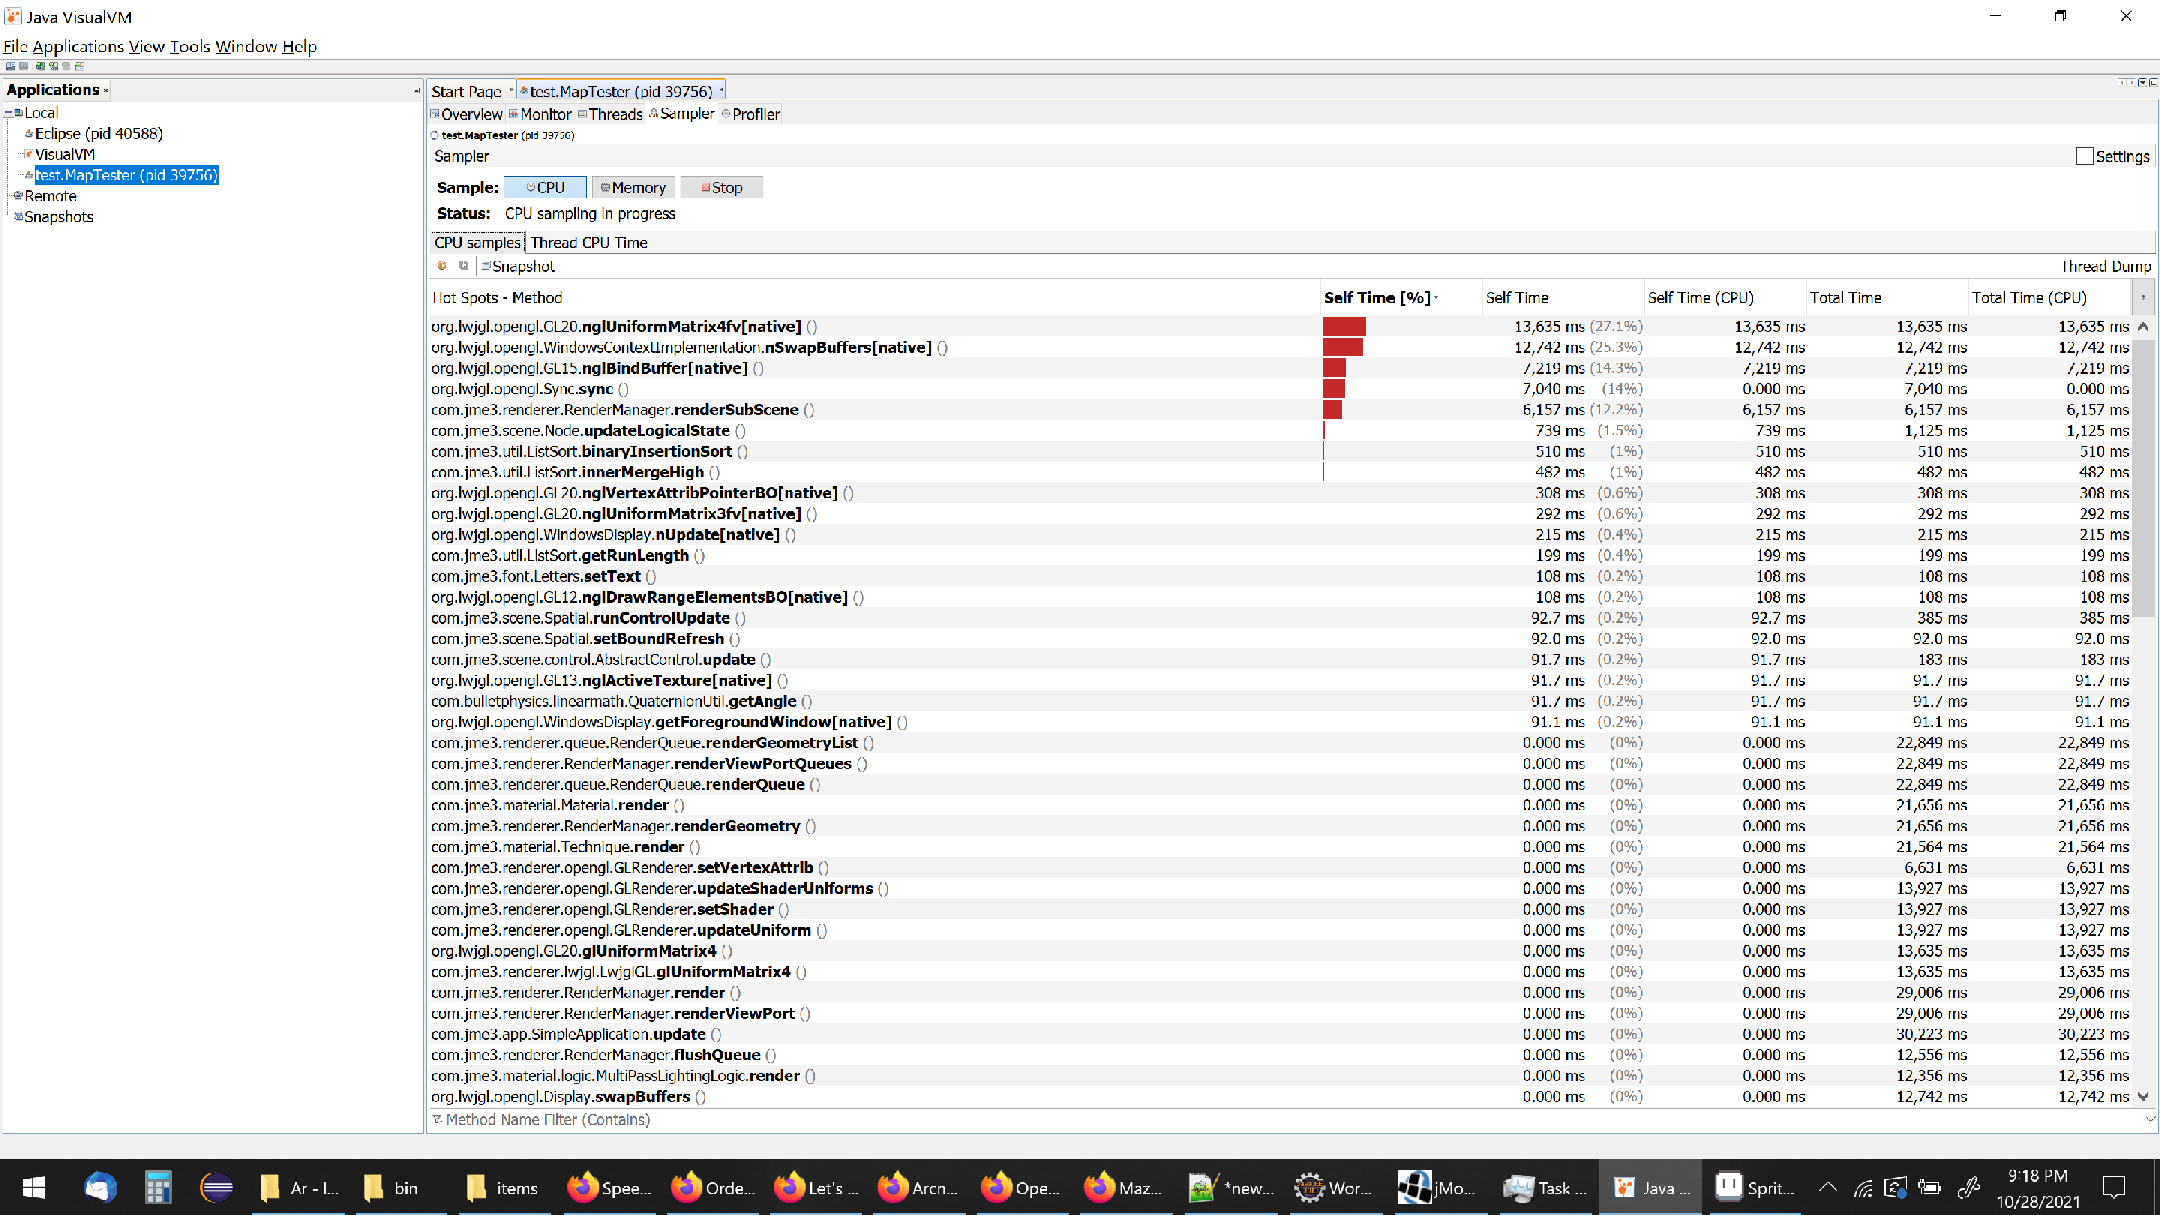
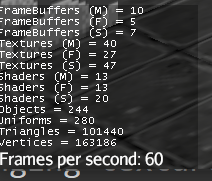
Here is the Debug window showing objects and everything. As you can see it is a very small foot print, but the engine can’t do 60fps (I have a very good laptop, my own engine could handle it).

So I’m thinking I’m doing something wrong, because I have a hard time believing JME would slow down on less than 10k objects, 20k triangles.

So I’m thinking that I did something wrong.

This test model is so simple, it is your basic SimpleApplication. I load the map and process the 64x64 grid to create Quads using about 30 different materials (using the same material over and over) to create North, South, West, East, Ceilings and floor walls.

I assign these walls to 4 different Nodes for handling like Floor, ceiling, secret Door, doors and walls and assign those to one Node that wraps the entire map into one parent.

Then I attach the main Node to rootNode.

That is all my test case does, no AppStates, no Controls. Just this Quads being displayed.
The FPS keeps ranging from 25 - 50fps sometime it hits 60fps.

I would like to see if anyone has an idea what to look at. I know I didn’t add any source code so it is impossible to see any real issues, but wanted to see if anyone experienced any issues like this and have any ideas.

Here is a picture of the test app I created, it doesn’t even have character movement or betterCharacter stuff active, just your default FlyCamera, so I’m above the city look out.
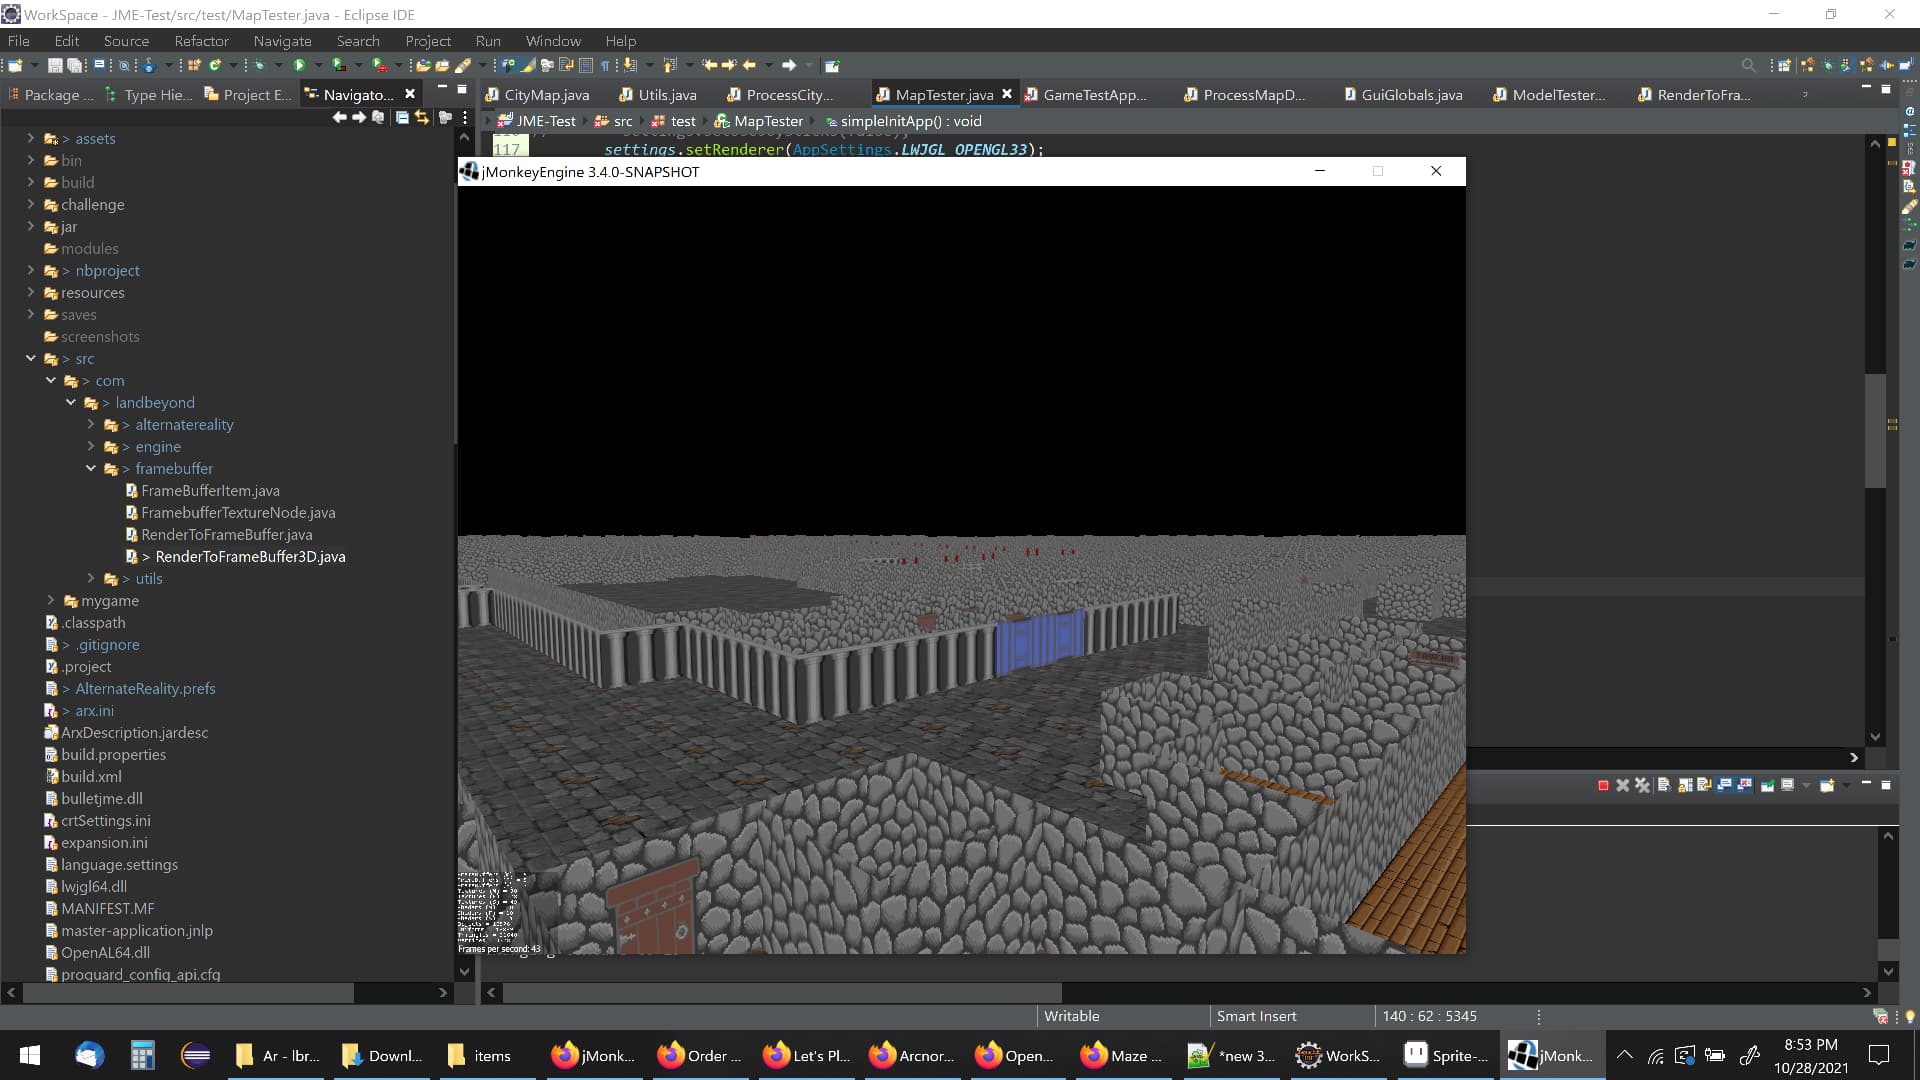
Thanks

Just taking a random guess: is there any chance your project has an excessive amount of System.out.println() calls for debugging?

I’ve experienced big FPS drops from too many println calls. For example, one time I was running some System.println() calls on every single geometry every frame, and the framerate went way down til i was done debugging and got rid of the println calls.

No, a couple printed to the console during loading of the map, and a couple during the processing of creating Quads.

The simpleUpdate() is blank, no controls, no add appstates.
The material using the standard common shading shader. Also, only has a diffuse color.

Have you tried to point the camera at the ground to see if the framerate goes up?

Anytime I have a random framerate drop, the first thing I do is fly above/below my scene and stare at an area where there are no (or very few) geometries, and if the framerate goes up drastically then you can tell that the issue is related to rendering the scene, as opposed to the issue being related to your code.

I have also experienced random FPS drops when I had a memory leak or when I got close to the max heap value alloted to the JVM on startup.

Yes, if I face away from the scence, the fps goes to 60.
here is memory info from VisualVM

Here is some CPU usage, when moving around the city.

Here is a memory snapshot.

With 9,000 + objects, I suspect you are draw dispatch limited. That’s 9,000+ separate draw calls per frame. That’s a lot for some hardware (especially if it might be bus limited).

Especially if you share materials, you would do well to batch wherever possible to reduce the number of objects.

(I’m personally pretty crazy with object creation and even I try to keep it below 3,000.)

Here is a screen shot of a scene that is doing considerably more than what you are talking about… with the JME stats enabled:
https://i.imgur.com/NfOj9mC.png

…I don’t have any mobs or anything so my object count is very low.

And I suspect that the object count goes down considerably.

yaRnMcDonuts means well, but they are just guessing randomly.

Edit: and for reference if you are already familiar with OpenGL, in generall a visible JME Geometry = a draw call… and that’s what “objects” is reporting.

1 Like

With all due respect, I don’t think me asking him additional questions that were unrelated to the object count was unwarranted, especially considering my random guesses are actual possible causes of random fps drop. Yes the high object count is the first thing that stands out, but he also specifically said

So I thought I would at least mention a few other causes that aren’t related to the object count since he said his engine did not have the problem, and draw count is not a JME or java exclusive problem.

I also reply to posts with the consideration that other people (aside from the OP) may lurk on this thread in the future, thinking they have a similar problem to the OP, and maybe one of the other random guesses I threw out will be their solution.

2 Likes

So are you using Batch rendering in the JME do draw all those objects, to get it down to 27 objects.

I didn’t think of doing batchNode (I think that is what you are talking about), since in my engine, it was able to do that on my machine and render the screen just fine.

If that is what you use, I’ll take a look at it.
So many objects could be turned into a batchNode.

I have a question about BatchNode. with a grid of 64x64, most of the walls use the same material, about 80% of the walls are the same. But doesn’t seems like it would be a good plan to turn it into one batchNode. Just wondering, is there an idea behind the best approach using BatchNode.

You thoughts helped out a bunch trying to figure things out.

Yes, my own engine could handle it just fine with the draw count and rendering and the cpu usage was extremely low but my engine is built for my game. So very small over head until a Generic Engine designed for all applications.

1 Like

In his example, the batching is done using his voxel approach so I can’t speak much on that.

To do regular batching you would want to just use GeometryBatchFactory’ instead of a BatchNode

I’ve never used the BatchNode, I believe it is intended for batching geometries where you still need to reference their individual instances in some way (like a batch of resource nodes that still need to be collected 1 at a time) but I never had a need for it so IDK much else.

Basically you want to make your batches just the right size so that you reduce the object count, without making any single batch too large, because the GPU will render the entire batch if any part of the object’s bounding volume is within in view of the camera.

Although I guess I’ll let someone with more technical experience answer this in more detail because I don’t have a great understanding of how it all works under the hood, I just know enough to use batching in my project.
In my experience, I just played around with different batch sizes in my scene editor until I got the best FPS results.

Batching worked great. Went from 10k objects down to 244 objects.
image

I’ll play with it, in my 64x64 grid, I broke it down to 16x16 batches based on the type of render. so the floors, ceilings, secret door, doors and walls all are in their own 16x16 batch that makes up the 64x64 batch.

around 300 objects, works great.

I didn’t use GeometryBatchFactory, I used between SimpleBatchNode and BatchNode, but I’ll do some research and check it out.

Are you making a game, from that screen shot, I was wondering.
Or are you just doing testing???

I didn’t mean any disrespect by it. To me the problem was extremely clear from the screen shot and I didn’t want him running down wrong paths. He is an experienced developer so I knew he probably already tried a bunch of things. I wanted to increase the importance of looking at object count since I was 100% sure that was the issue.

I knew from his other posts that his old engine carefully managed all of the draw stuff.

As yaRnMcDonuts indicated, I create custom meshes. For static and mostly static things, I just find it easier and more efficient. I’ve created lots of meshes before and so it’s second nature by now.

I’ve also never used JME’s BatchNode but I understand what it’s doing in principle and watched it being developed by fellow team mates “back in the day”.

The built in stuff is pretty easy to use and fine for a lot of cases. You are probably fine with it and it will let you solve whatever your next problems/tasks will be.

This is the prototype that is being used to test the new MOSS libraries that will eventually be open sourced. They are the underpinnings of the new Mythruna engine… so in that case, they will be the core of my game’s new engine. (MOSS = Mythruna Open Source Software)

You can read more about that here: The MOSS Initiative - Simsilica, LLCSimsilica, LLC

If you are curious, you can see some video of that prototype here:

And here:

I remember watching that video when you posted it early about the size and lighting. Looks great. That is a ton of lights.

1 Like

Thanks. It only looks like a ton of lights because the lighting gets baked into the geometry dynamically… like other block world games.

So technically there are only two lights in the whole scene. Sunlight and “local light”.