Visual stutter / hiccups even in simple applications, framerate drops?

Hi,

I’m running the jMonkeyEngine SDK 3.1-alpha1 on Windows 7 64-Bit (but the problem occured on 3.0 stable too).

I’m experiencing some slight stuttering / hiccups in the rendering even when running very simple apps like the code snippet below.

I tried to log the frame rates over time and I’m not sure if there is a correlation.
The stuttering happens inconsistently about every 3 seconds and right after the application starts (the latter wouldn’t be much of a problem on its own).
The stuttering itself is very subtle, but it is more noticable at lower framerates, hence the limit in the code snippet to 30 fps.

Here is a graph of a log for about 15 secs. (“fps” should really be “tpf”):

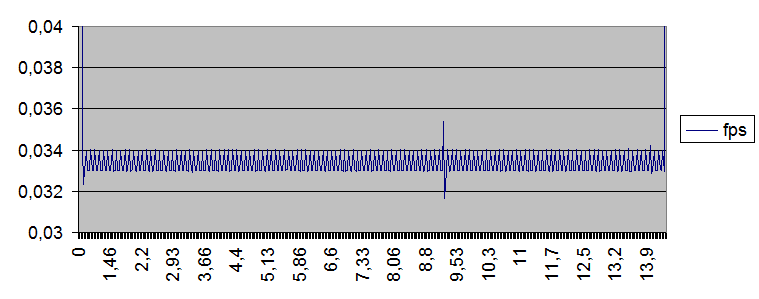
It doesn’t look like the actual frame rate reflects the problem. I’m not sure if the spike at about 9 secs. correlates to some visual stuttering (there should definitly be more spikes).

While doing research on the forums I read about increasing the heap memory size for the Garbage Collection (of which I have no experience with) and added this to the VM options in the projects Run settings: -Xms1024m -Xmx1024m -XX:MaxDirectMemorySize=2048m
But it didn’t change anything. It would have surprised me anyway if there would be memory problems in such a simple scene.

Here is the basic testing application:

public class Main extends SimpleApplication
{
	BufferedWriter log;
	Geometry geometry;
	float time;

	public static void main( String[] args )
	{		
		// Settings
		AppSettings settings = new AppSettings( true );
		settings.setTitle( "Test" );
		settings.setResolution( 1024, 768 );
		settings.setFullscreen( false );
		settings.setFrameRate( 30 );

		// Create and start app
		Main app = new Main();
		app.setShowSettings( false );
		app.setSettings( settings );
		app.start();
	}

	private Main()
	{
		super( new StatsAppState(), new DebugKeysAppState() );
	}

	@Override
	public void simpleInitApp()
	{
		// Log
		try
		{
			File logFile = new File( System.getProperty( "user.dir" ) + "/log.csv" );
			System.out.println( "Path: " + logFile.getCanonicalPath() );
			log = new BufferedWriter( new FileWriter( logFile ) );
			log.write( "time,fps\n" );
		}
		catch ( Exception e )
		{
			e.printStackTrace();
		}
		
		// Test Scene
		geometry = new Geometry( "TestGeom", new Box( 2, 2, 2 ) );
		geometry.setMaterial( new Material( assetManager, "Common/MatDefs/Misc/ShowNormals.j3md" ) );
		rootNode.attachChild( geometry );
		
		// Time
		time = 0.0f;
	}
	
	@Override
	public void destroy()
	{
		super.destroy();
		
		// Log
		try
		{
			log.close();
		}
		catch ( Exception e )
		{
			e.printStackTrace();
		}
	}

	@Override
	public void simpleUpdate( float tpf )
	{
		// Animate
		geometry.rotate( 0, tpf * 1.5f, 0 );
		
		// Log
		try
		{
			log.write( time + "," + tpf + "\n" );
		}
		catch ( Exception e )
		{
			e.printStackTrace();
		}
		
		// Time
		time += tpf;
	}

	@Override
	public void simpleRender( RenderManager rm )
	{
		//TODO: add render code
	}
}

On a side note the problem also occurs in more complex projects, where I was even using framerate independent timing.

Do other people experience similar problems?
What could be a possible reason?

Thanks in advance for any advice!

Try removing your home grown logging and see if the problem persists. Your home-grown logging approach (instead of using any of the standard or built in ones) is going to be very garbage heavy. Every frame you are creating new strings, new byte[] arrays, etc… Personally, even with the off-the-shelf logging packages, I wouldn’t do per-frame logging and expect GC to behave nicely.

Alternately, the other thing you can do is start displaying the free/used memory. I suspect your performance drops coincide with full GC. Though with those memory settings I’d expect you to be able to run a while before they started happening.

Only showing the free memory somehow will really show whether it is or isn’t a GC problem. And the pauses generally only come when garbage is collecting so fast that the incremental GC can’t keep up.

Note: Mythruna, as an example, is a HUGE game and I only set heap to 512m max. (I have a super large direct memory but regular heap is pretty small.)

If I got that right he added the logging after the error occured but you are right otherwise.

You use the SDK, download the Profiler Plugin and have a look at the Memory Values, there you can see if they gc is the problem.

Another thing which comes to my mind since stuttering reporrs are quite rare around here is: Drivers, Anti Virus and the like. Did you try it on another system?

Generally you would look at the Profiler for some method which takes too long per frame but when your Graph is right that issue doesnt seem to come from jme.

How does it work in fullscreen? (And hence bypassing the OS/Window Manager)

Maybe. It would be good to have clarification because I could easily see the events happening like:
-had issue with own more complicated code
-added logging to that and saw issue
-created simpler test case with logging already in it.

…which invalidates the test of the simpler test case.

Do you have an NVidia card by chance? If so go to the nvidia control panel and turn off “Threaded optimization”. NVidia card’s have this on by default and it causes all sorts of weird lockups which look like stutters. I know there is a way to fix this but I haven’t sat down to figure it out yet.

1 Like

Thanks for the input guys, I appreciate it!

As Darkchaos guessed the logging was actually added later on to the most basic application I could think off. But I removed it again, just to be sure. The updated barebones sample code is this now (the only thing happening each frame is the rotation of the cube):

public class Main extends SimpleApplication
{
	Geometry geometry;

	public static void main( String[] args )
	{		
		// Settings
		AppSettings settings = new AppSettings( true );
		settings.setTitle( "Test" );
		settings.setResolution( 1024, 768 );
		settings.setFullscreen( false );
		settings.setFrameRate( 30 );

		// Create and start app
		Main app = new Main();
		app.setShowSettings( false );
		app.setSettings( settings );
		app.start();
	}

	private Main()
	{
		super( new StatsAppState(), new DebugKeysAppState() );
	}

	@Override
	public void simpleInitApp()
	{		
		// Test Scene
		geometry = new Geometry( "TestGeom", new Box( 2, 2, 2 ) );
		geometry.setMaterial( new Material( assetManager, "Common/MatDefs/Misc/ShowNormals.j3md" ) );
		rootNode.attachChild( geometry );
	}

	@Override
	public void simpleUpdate( float tpf )
	{
		// Animate
		geometry.rotate( 0, tpf * 1.5f, 0 );
	}

	@Override
	public void simpleRender( RenderManager rm )
	{
		//TODO: add render code
	}
}

I just tried it in fullscreen and unfortunatly the problem still occurs.

Thanks for the hint, just installed the plugin and will check it out.

I’m running JME on a laptop with an AMD Radeon HD 7730M (which JME apparently uses according to the debug output), but it can switch to an integrated Intel HD 4000 under certain circumstances, so I’m gonna verify that and maybe try to find some new drivers.

So I’m doing more testing right now, will report back…

Is this happening after the application’s start and after some time it is going better?

No, it happens more noticeably just after the application launch, and then about every 3 seconds without getting better.

I just ran the application with the profiler on, and observed the VM telemetry tab.
The memory (heap) graph stays consistent all the time (horizontal line) at ~80 Mb.
The memory (GC) graph is just a flat line with max relative time spent in GC at 0.0% all the time.
The threads / loaded classes graph has a slight increase over time from 2059 to 2065 classes, but that doesn’t seem to coincide with the stutter.

What else should I look for?

Still have to test it on another machine…

That… because it’s starting to sound machine specific. Or at least there is something other than the JME app causing the hiccup.

Meanwhile I found out that when I switch my system to use the integrated Intel HD4000 chip the problem is gone. So it’s definitly a hardware/driver issue with my AMD Radeon HD 7730M. Need to look out for some updated drivers…

Thank you so much. And yes, I dont mind necroing this thread - just wanted to let people know that this fixed my game hiccup (exactly like described here).