I am testing instanced rendering right now and I noticed, that my frame rate does not change based on how many objects are on the screen, but only based on how many nodes are in the scene. I zoom in until I see only a single triangle on screen, or I zoom out until I can see the entire scene at once but the frame rate is constant.
I believe this is because objects are not correclty culled for being out of vision. I am probably doing something wrong. In order to analyse what is happening I would appreciate to know exactly which nodes are rendered, so if there is any way to find out I would very much appreciate to know.
Of course I am open to any other tips and recommendations.
No I mean a constant 29 FPS. It is at 60 FPS if I cut down the number of nodes within the scene or the number of instances in the InstancedNode dramatically. I am talking about actual, real lag.
After some more playing around I noticed that the lag goes down if I zoom in on a different part of the scene. If the camera is looking at the origin (0, 0) the number of rendered triangles is equal to the number of total triangles in the scene. The further I move away from the origin (while still being zoomed in) the lower the number of rendered triangles becomes. It feels to me like all my nodes somehow extend to the origin even though there they contain no meshes to be rendered at that point.
Yeah. It’s still vsync. It can’t render at 60fps, so the next best thing is 30fps - which is half-synced. It’s the best it can do to maintain vertical sync. If you don’t want that behavior, you need to disable vsync.
60fps - 1/1 ratio with your monitor refresh rate.
30fps - half ratio.
20fps - 1/3
15fps - 1/4
… not sure what happens after that. Probably keeps going until there’s nothing left.
And just to note - just because an object isn’t in view - doesnt mean you don’t have to worry about it. It will cull them, but if you have large scenes you need to split them into chunks, and add/remove them as the camera moves.
It is not VSync. I get the same FPS with VSync turned off. Furthermore, the FPS changed when I moved the camera away from the origin as described in my previous reply. It appears to me, that as long as my camera stays at the origin, no nodes are being culled. As I move the camera away from the origin nodes start being culled.
My scene is already divided into chunks. Right now I have 1010 Geometries for terrain and 1010 InstancedNode’s for trees. Each InstancedNode contains somewhere between 1212 and 3232 many Geometries.
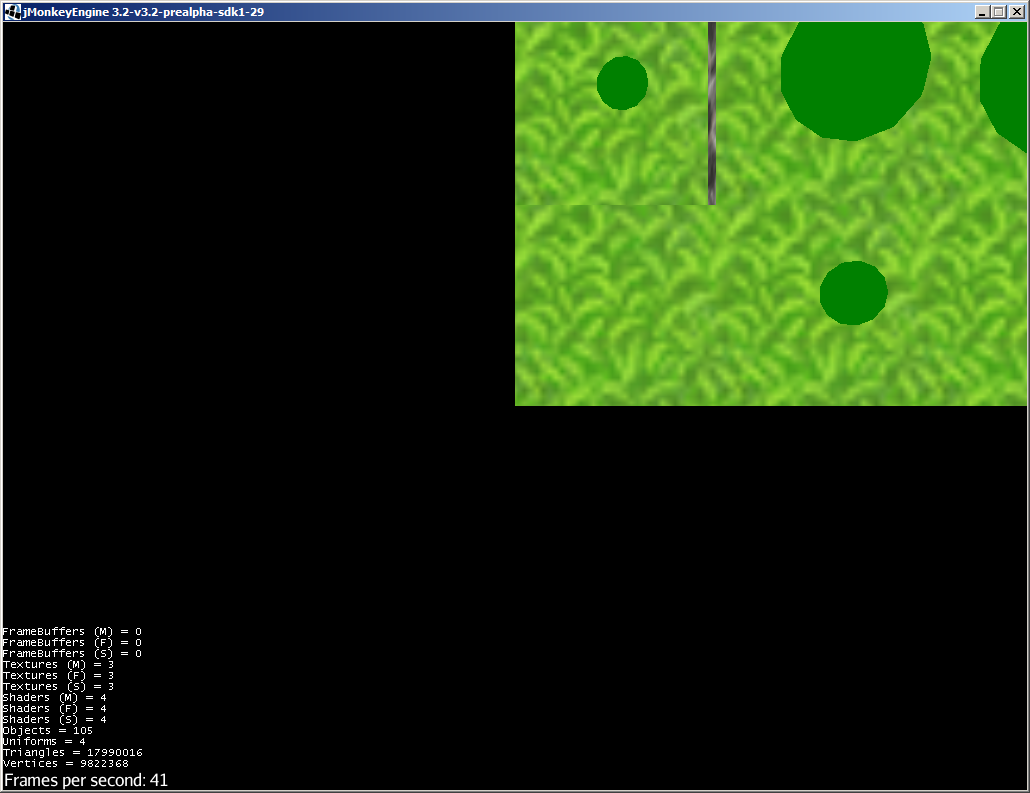
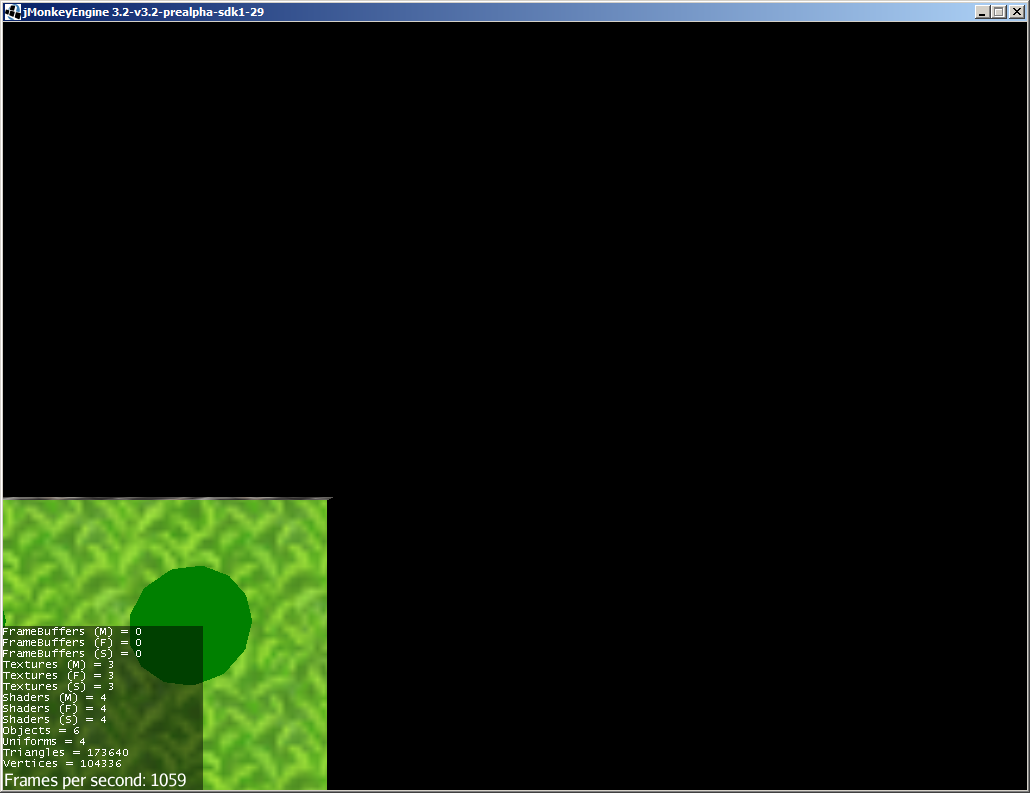
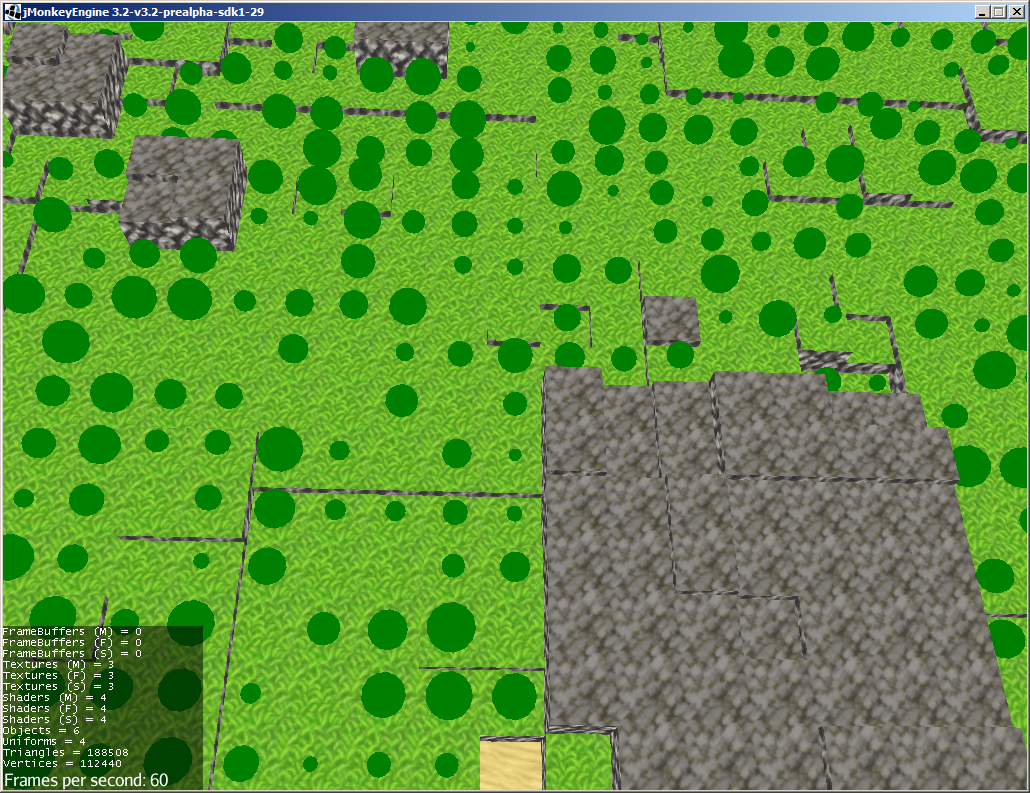
Here you go. I took 2 screenshots from the same scene. Only difference is the position of the camera. The first screenshot is with the camera zoomed in on the origin. The second screenshot is with the camera zoomed in at the opposite corner of the scene:
It is an InstancedNode with many many trees (the green spheres for debugging purposes in the screenshot). This is, after all, a big terrain with forests and whatnot. The actual tree model will be low-poly though (perhaps changing depending on zoom level) so it will drastically cut down the actual number of triangles.
Regardless of that I would still like to know why ALL triangles need to be rendered at the lower-left corner while only 1/10th is being rendered when the camera is at the top-right corner. It is obvious that something is going wrong.
The simplest way to do as you requested is calling .checkCulling(Camera cam) on whatever it is you want to check, but it’s obvious enough that they aren’t being culled. The first port of call would be to ensure the the cullHint it set to dynamic, and secondly to ensure each object is individual, and not part of one huge mesh. If an object is not in view it will be culled, but it won’t cull any of it if even an very small portion of it is within view. Is it possible that some of your objects are actually one very large object merged together?
As I said a couple of times, I have 1010 Geometries, each with a custom mesh, for terrain. And then 1010 InstancedNode’s each one with somewhere between 1212 and 3232 Geometries (Sphere) for trees.
The culling works. If I move the camera too far off the edge everything is being culled away. If I move the camera to the top-right all the terrain and all the trees of the lower and left portions are culled away.
But for some reason the terrain and trees to the right and top of the camera are never culled. (unless I move the camera far away from any terrain).
I suspect the bounds of the nodes to be wrong somehow but I dont know JME3 enough yet to properly debug it. Which properties of a Node are responsible for culling? Where do I find how they are calculated?
I did some more testing and found out that the BoundingBoxes for the InstancedNode’s are wrong. Even though all the Geometry within the node fits into a 323216 cube, the BoundingBox of the node always extends to the origin (0, 0, 0) no matter where the node is placed.
What controls the bounding box of an InstancedNode? Is there some kind of trap that I am running into when creating the node or its geometries?
As you can see the BoundingVolume was extended significantly along the Y-axis for some reason. I assure you, that the InstancedNode has ONLY one child, and that child is the tree Geometry.
Can anybody please explain to me how this is happening?
Okay, I can not figure out why the BoundingVolume is incorrect. I cant find the relevant piece of code.
Instead: Can I set the WorldBound of a Node directly? I know exactly what the bounding volume of the node is going to be since it is a very simple box. If I could just directly overwrite the WorldBounds manually, I think it would solve the problem.
Edit:
I did this very very dirty hack (just for testing purposes!) and NOW I get constant 60 FPS with VSync on:
public static class FixedBoundNode extends InstancedNode {
    public BoundingBox ownBounds = null;
    public TestNode(String name) {
        super(name);
    }
    @Override
    public BoundingVolume getWorldBound() {
        if (ownBounds == null) {
            return super.getWorldBound();
        }
        return ownBounds;
    }
}
Everything still gets rendered nicely btw. All terrain and trees within the cameras view are rendered.
This should prove, that it is indeed the BoundingVolume which is at fault here. Now the real question is: How can I debug why the BoundingVolume is wrong?
It will not solve your problem at all… as jayfella said 18millions triangles is just to much …instanced or not…
The fps are better when you move to the “top right” because your instance node is culled (thanks to the bad bounding box which stay at 0, 0, 0), and then as soon as you will increase the bounding this node will never be culled anymore :s
You have to split your trees into smaller chunks that you load/unload on the fly when you move the cam (search for paging system). You can always use instancing but one instance by chunk and not one for the whole world :s
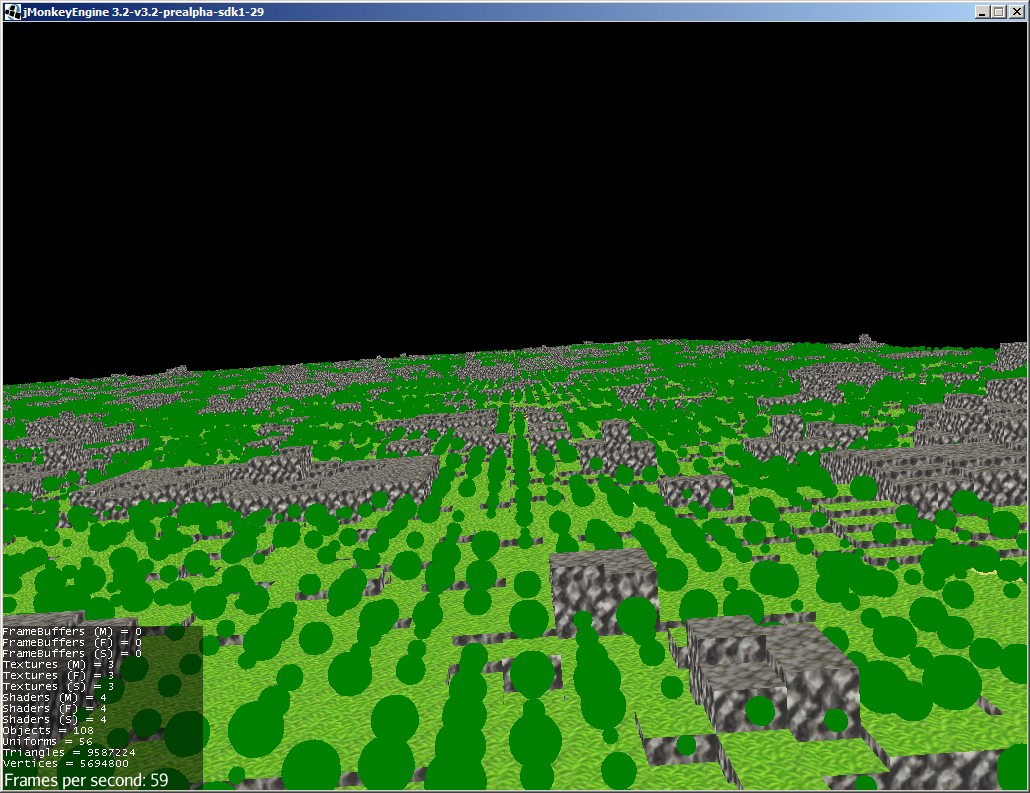
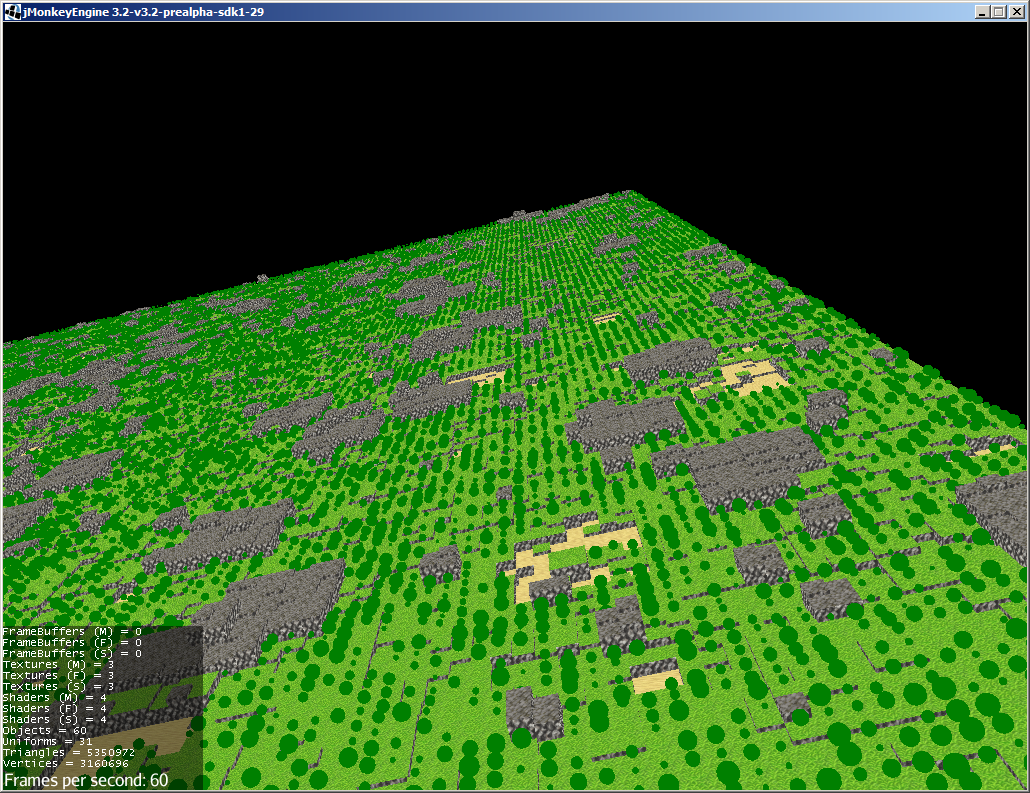
As you can tell from the numbers, culling works now; triangle counts reflect the number of trees visible on screen. The FPS are good as long as I dont zoom out too far. The scene from these screenshots is still the same scene as the one from the screenshots above with the bad performance. (except for the fact trees and terrain are randomly generated)
The hack with the BoundingBox is the only change I made in code.