Thanks for testing and your effort is much appreciated!
I think we should have this test at the PR after fixing this issue ![]() .
.
What happens when you remove this? Does it crash, as well?
Thanks for testing and your effort is much appreciated!
I think we should have this test at the PR after fixing this issue ![]() .
.
What happens when you remove this? Does it crash, as well?
I ran your testcase and I am getting this JVM crash-logs:
#
# A fatal error has been detected by the Java Runtime Environment:
#
#  SIGSEGV (0xb) at pc=0x00007f0f718b7cda, pid=341471, tid=341501
#
# JRE version: OpenJDK Runtime Environment JBR-11.0.10.8-1145.96-jcef (11.0.10+8) (build 11.0.10+8-b1145.96)
# Java VM: OpenJDK 64-Bit Server VM JBR-11.0.10.8-1145.96-jcef (11.0.10+8-b1145.96, mixed mode, tiered, compressed oops, g1 gc, linux-amd64)
# Problematic frame:
# C  [libc.so.6+0x98cda]  __libc_free+0x1a
#
# No core dump will be written. Core dumps have been disabled. To enable core dumping, try "ulimit -c unlimited" before starting Java again
#
# If you would like to submit a bug report, please visit:
#   https://bugreport.java.com/bugreport/crash.jsp
# The crash happened outside the Java Virtual Machine in native code.
# See problematic frame for where to report the bug.
#

---------------  S U M M A R Y ------------

Command Line: -Dfile.encoding=UTF-8 -Duser.country=US -Duser.language=en -Duser.variant com.jme3.alloc.examples.TestReleaseDirectMemory

Host: Intel(R) Core(TM) i3-7020U CPU @ 2.30GHz, 4 cores, 11G, Debian GNU/Linux 11 (bullseye)
Time: Sun Apr  2 14:24:31 2023 EET elapsed time: 3.299835 seconds (0d 0h 0m 3s)

---------------  T H R E A D  ---------------

Current thread (0x00007f0f10491000):  JavaThread "com.jme3.alloc.gc.MemoryScavenger" daemon [_thread_in_native, id=341501, stack(0x00007f0f0a900000,0x00007f0f0aa00000)]

Stack: [0x00007f0f0a900000,0x00007f0f0aa00000],  sp=0x00007f0f0a9fe7b0,  free space=1017k
Native frames: (J=compiled Java code, A=aot compiled Java code, j=interpreted, Vv=VM code, C=native code)
C  [libc.so.6+0x98cda]  __libc_free+0x1a
C  [libjmealloc.so+0x1fbe]  Java_com_jme3_alloc_util_NativeBufferUtils_destroy__J+0x24
J 1385  com.jme3.alloc.util.NativeBufferUtils.destroy(J)V (0 bytes) @ 0x00007f0f5ff46404 [0x00007f0f5ff46340+0x00000000000000c4]
J 1384 c1 com.jme3.alloc.gc.GarbageCollectibleBuffers.deallocate(JZ)V (68 bytes) @ 0x00007f0f58c19c1c [0x00007f0f58c19120+0x0000000000000afc]
j  com.jme3.alloc.gc.MemoryScavenger.run()V+20
v  ~StubRoutines::call_stub
V  [libjvm.so+0x847c31]  JavaCalls::call_helper(JavaValue*, methodHandle const&, JavaCallArguments*, Thread*)+0x331
V  [libjvm.so+0x845eb0]  JavaCalls::call_virtual(JavaValue*, Klass*, Symbol*, Symbol*, JavaCallArguments*, Thread*)+0x160
V  [libjvm.so+0x845f81]  JavaCalls::call_virtual(JavaValue*, Handle, Klass*, Symbol*, Symbol*, Thread*)+0x81
V  [libjvm.so+0x8e695c]  thread_entry(JavaThread*, Thread*)+0x6c
V  [libjvm.so+0xd264d0]  JavaThread::thread_main_inner()+0xd0
V  [libjvm.so+0xd22319]  Thread::call_run()+0x149
V  [libjvm.so+0xb93f7e]  thread_native_entry(Thread*)+0xee
This is the most important part, the crash happens on MemoryScavenger thread (due to the deallocate call) and by removing System.gc() it works fine, I believe now this is a strong reason to synchronize the calls, but we could synchronize both the allocate and deallocate and remove the ConcurrentNativeBufferAllocator because we would totally do all synchronization on the NativeBufferAllocator and the MemroyScavenger will use synchronized version of deallocate.
EDIT:
The logs when synchronizing the stack:
Apr 02, 2023 5:57:46 PM com.jme3.alloc.gc.GarbageCollectibleBufferAllocator deallocate
SEVERE: Buffer 140492541018528 is not found!
Apr 02, 2023 5:57:47 PM com.jme3.alloc.gc.GarbageCollectibleBufferAllocator deallocate
SEVERE: Buffer 140492341784064 is not found!
Apr 02, 2023 5:57:47 PM com.jme3.alloc.gc.GarbageCollectibleBufferAllocator deallocate
SEVERE: Buffer 140492541018528 is not found!
Apr 02, 2023 5:57:49 PM com.jme3.alloc.gc.GarbageCollectibleBufferAllocator deallocate
SEVERE: Buffer 140492544211776 is not found!
Apr 02, 2023 5:57:50 PM com.jme3.alloc.gc.GarbageCollectibleBufferAllocator deallocate
SEVERE: Buffer 140492341784064 is not found!
Apr 02, 2023 5:57:52 PM com.jme3.alloc.gc.GarbageCollectibleBufferAllocator deallocate
SEVERE: Buffer 140492341784064 is not found!
Apr 02, 2023 5:58:08 PM com.jme3.alloc.gc.GarbageCollectibleBufferAllocator deallocate
SEVERE: Buffer 140492341784064 is not found!
Apr 02, 2023 5:58:09 PM com.jme3.alloc.gc.GarbageCollectibleBufferAllocator deallocate
SEVERE: Buffer 140492341784064 is not found!
Apr 02, 2023 5:58:10 PM com.jme3.alloc.gc.GarbageCollectibleBufferAllocator deallocate
SEVERE: Buffer 140492341784064 is not found!
Apr 02, 2023 5:58:11 PM com.jme3.alloc.gc.GarbageCollectibleBufferAllocator deallocate
SEVERE: Buffer 140492343881232 is not found!
Apr 02, 2023 5:58:13 PM com.jme3.alloc.gc.GarbageCollectibleBufferAllocator deallocate
SEVERE: Buffer 140492341784064 is not found!
Apr 02, 2023 5:58:15 PM com.jme3.alloc.gc.GarbageCollectibleBufferAllocator deallocate
SEVERE: Buffer 140492541018528 is not found!
Apr 02, 2023 5:58:19 PM com.jme3.alloc.gc.GarbageCollectibleBufferAllocator deallocate
SEVERE: Buffer 140492541018528 is not found!
Apr 02, 2023 5:58:26 PM com.jme3.alloc.gc.GarbageCollectibleBufferAllocator deallocate
SEVERE: Buffer 140492541018528 is not found!
Apr 02, 2023 5:58:28 PM com.jme3.alloc.gc.GarbageCollectibleBufferAllocator deallocate
SEVERE: Buffer 140492341784064 is not found!
Apr 02, 2023 5:58:28 PM com.jme3.alloc.gc.GarbageCollectibleBufferAllocator deallocate
SEVERE: Buffer 140492341784064 is not found!
The approach is either to use ConcurrentHashMap as you have suggested or to consider the MemoryScavenger to use ConcurrentBufferAllocator#deallocate(long) which is what I did here (it’s already synchronized).
Well, I synchronized the calls and everything works regarding the double free problem that we were facing, however, I sometimes face this jvm crash on the Allocator-1 thread, the crash logs stops here and the execution halts with a timeout message sometimes:
#
# A fatal error has been detected by the Java Runtime Environment:
#
#  SIGSEGV (0xb) at pc=0x00007fc5ba903419, pid=442240, tid=442324
#
# JRE version: OpenJDK Runtime Environment (17.0.6+10) (build 17.0.6+10-Debian-1)
# Java VM: OpenJDK 64-Bit Server VM (17.0.6+10-Debian-1, mixed mode, sharing, tiered, compressed oops, compressed class ptrs, g1 gc, linux-amd64)
# Problematic frame:
# C  [libc.so.6+0x97419]
[timeout occurred during error reporting in step "printing problematic frame"] after 30 s.
# No core dump will be written. Core dumps have been disabled. To enable core dumping, try "ulimit -c unlimited" before starting Java again
#
# If you would like to submit a bug report, please visit:
#   https://bugs.debian.org/openjdk-17
# The crash happened outside the Java Virtual Machine in native code.
# See problematic frame for where to report the bug.
#

---------------  S U M M A R Y ------------

Command Line: -Dfile.encoding=UTF-8 -Duser.country=US -Duser.language=en -Duser.variant com.jme3.alloc.examples.TestReleaseDirectMemory

Host:
[timeout occurred during error reporting in step "printing summary machine and OS info"] after 30 s.
Time: Tue Apr  4 01:32:52 2023 EET elapsed time: 275.813592 seconds (0d 0h 4m 35s)

---------------  T H R E A D  ---------------

Current thread (0x00007fc54c832cc0):  JavaThread "Allocator-1" daemon [_thread_in_native, id=442324, stack(0x00007fc536bfe000,0x00007fc536cfe000)]

Stack: [0x00007fc536bfe000,0x00007fc536cfe000],  sp=0x00007fc536cfc760,  free space=1017k
Native frames: (J=compiled Java code, j=interpreted, Vv=VM code, C=native code)
C  [libc.so.6+0x97419]
I cannot print the native error code; because the application crashes before printing the error value, this crash doesn’t happen with Lwjgl-3 buffer allocator…
I think it’s a type of Out of Memory Errors, but I don’t have much knowledge to debug this for now, if you guys have any hints, I will appreciate that.
@Ali_RS I wonder if Lwjgl-3 really uses libc to allocate memory as their first resort, on their MemoryUtil.java docs, they say that they utilize JNI as a last resort after first trying with the sun.misc.Unsafe which is assumed to be available on most JDKs as far as I know, then it tries with java reflection, but what type of calls might be involved?
EDIT: It also sometimes happens with Allocator-2 thread.
EDIT2:
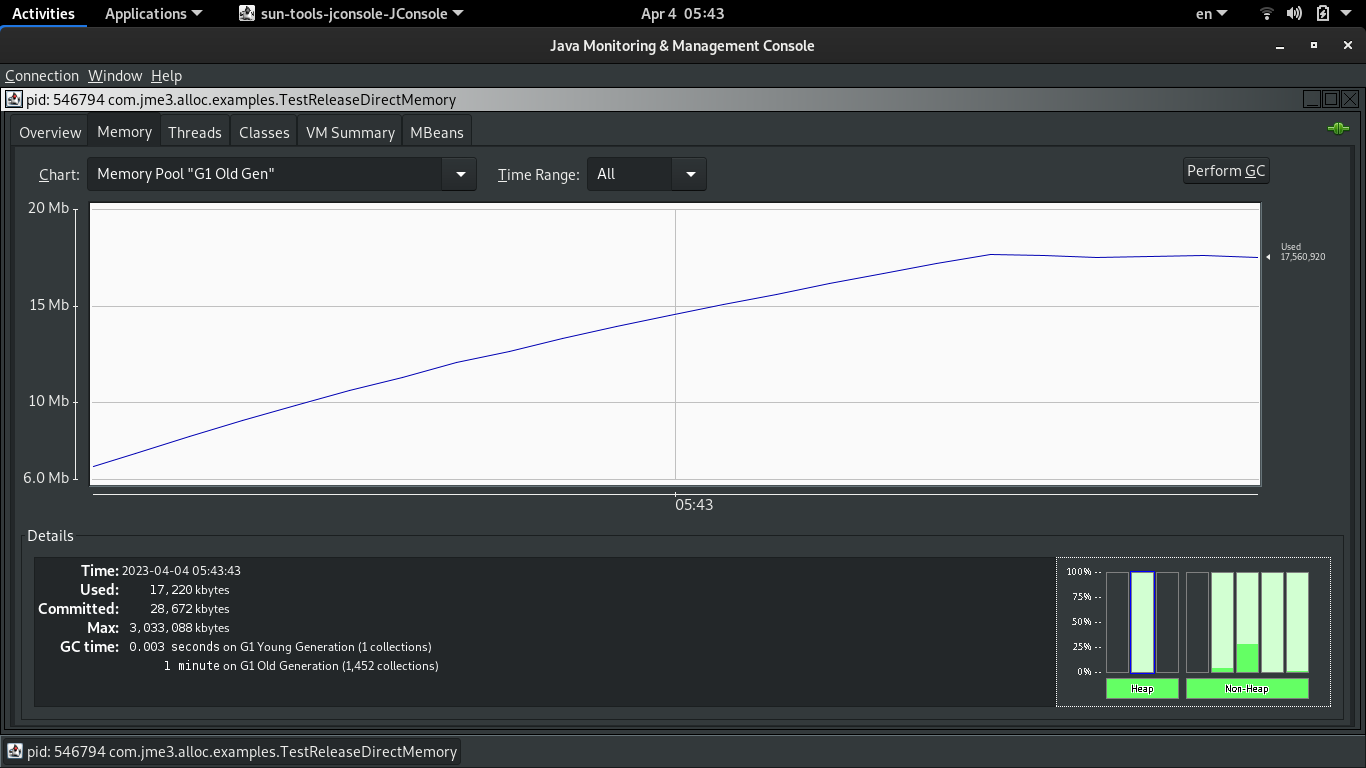
Here is the heap profile using jconsole:
Things to look at, the graph shows the heap allocations, and the GC time is displayed at the bottom box, in the case of jme-alloc, the GC time is high.
From my understanding, they use “jemalloc” (a general purpose malloc implementation) native library by default.
but I guess because that c library works with memory address (a long value) and does not support java ByteBuffer, so LWJGL3 needs to use Uusafe to instantiate a java Buffer and inject the address, and capacity,… into it.
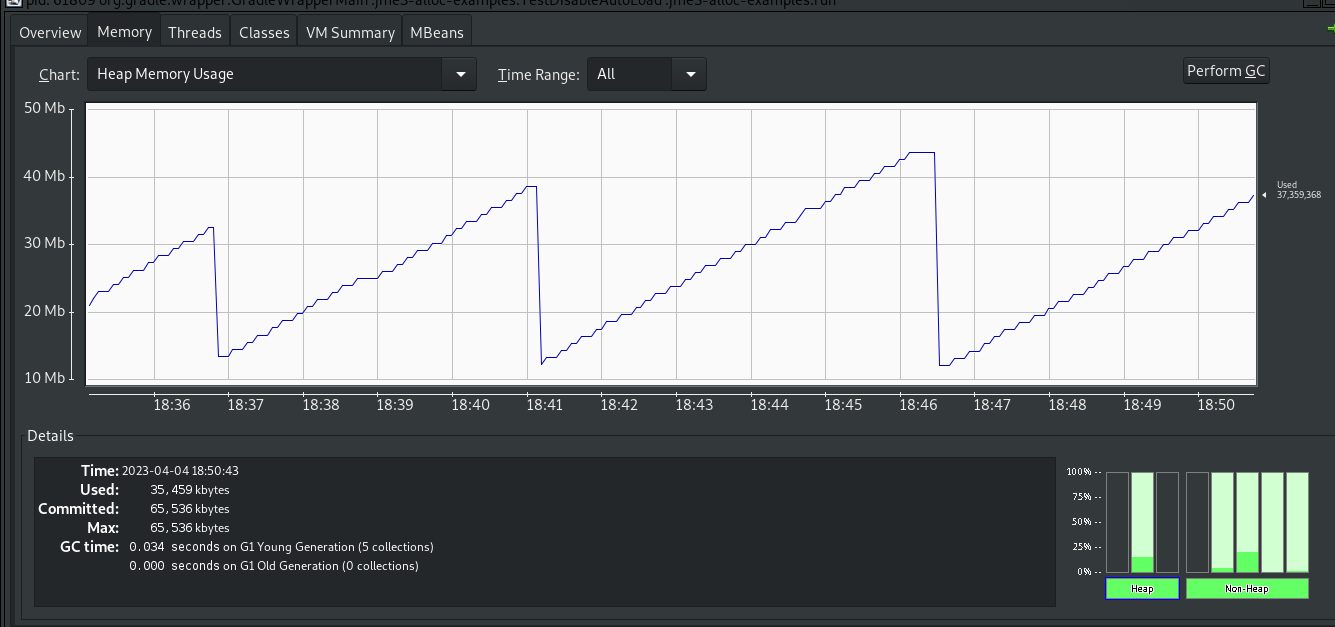
I found the problem here that leads to a long GC collecting time, the problem arises from synchronizing the GC MemoryScavenger with the manual dealloctor, which posses a large waiting time, the fix for this is to loosely couple them instead using monitor locks through synchronized, and here is the graph and the GC time:
The code would be:
// manual calls
public synchronized void deallocate(long bufferAddress) {
        /* return if the buffer is not in the list of the referenceQueue */
        if (!collectibles.containsKey(bufferAddress)) {
            if (!(Thread.currentThread().getName().equals(MemoryScavenger.class.getName()))) {
                logger.log(Level.SEVERE, "Buffer " + bufferAddress + " is not found! ");
            }
            return;
        }
        GarbageCollectibleBuffer collectible = collectibles.get(bufferAddress);
        if (collectible == null) {
            return;
        }
        NativeBufferUtils.destroy(bufferAddress);
        collectible.setMemoryAddress(0);
        collectibles.remove(bufferAddress);
    }

    // called by MemoryScavenger
    protected synchronized void deallocate(GarbageCollectibleBuffer collectible) {
        long address = collectible.getMemoryAddress();
        if (address == 0) {
            return;
        }
        NativeBufferUtils.destroy(address);
        collectible.setMemoryAddress(0);
        collectibles.remove(address);
    }
@Ali_RS I understood now why the LwjglBufferAlloctor uses 2 different free calls, the calls should be loosely synchronized but without blocking…
jme3-alloc-v1.0.0-pre-gamma-1 is now available with optimizations regarding GC calls:
Thanks, I tried the new version and the app does not crash anymore with the previous test but running the below test, memory usage keeps growing until I run out of memory. It works fine with other allocators.
Also, I noticed debug log file is still generated even though I am not using debug version. (ok, I needed to remove the old binary for the new one to be extracted. I think you should check their modification time or CRC hash and re-extract if they are different)
import com.jme3.alloc.ConcurrentBufferAllocator;
import com.jme3.app.SimpleApplication;
import com.jme3.util.BufferAllocator;
import com.jme3.util.BufferAllocatorFactory;
import com.jme3.util.BufferUtils;
import com.jme3.util.LWJGLBufferAllocator;


import java.nio.*;
import java.util.Queue;
import java.util.concurrent.ConcurrentLinkedQueue;

public class TestReleaseDirectMemory extends SimpleApplication {

    public static void main(String[] args){
        System.setProperty(BufferAllocatorFactory.PROPERTY_BUFFER_ALLOCATOR_IMPLEMENTATION, TestAllocator.class.getName());
        TestReleaseDirectMemory app = new TestReleaseDirectMemory();
        app.start();
    }

    @Override
    public void simpleInitApp() {
        System.out.println("Allocator=" + System.getProperty(BufferAllocatorFactory.PROPERTY_BUFFER_ALLOCATOR_IMPLEMENTATION));

        final Queue<Buffer> bufferQueue = new ConcurrentLinkedQueue<>();

        Thread allocator1 = new Thread(() -> {
            System.out.println("Running buffer allocator 1");
            while (true) {
                FloatBuffer buffer = BufferUtils.createFloatBuffer(524288);
                for (int i = 0; i < 100000; i++) {
                    buffer.put(Float.MAX_VALUE);
                }

                bufferQueue.add(buffer);
            }
        });
        allocator1.setDaemon(true);
        allocator1.start();

        Thread allocator2 = new Thread(() -> {
            System.out.println("Running buffer allocator 2");
            while (true) {
                ShortBuffer buffer = BufferUtils.createShortBuffer(524288);
                for (int i = 0; i < 100000; i++) {
                    buffer.put(Short.MAX_VALUE);
                }

                bufferQueue.add(buffer);
            }
        });
        allocator2.setDaemon(true);
        allocator2.start();

        Thread deallocator = new Thread(() -> {
            System.out.println("Running buffer deallocator");
            while (true) {
                Buffer buffer = bufferQueue.poll();
                if (buffer != null) {
                    BufferUtils.destroyDirectBuffer(buffer);
                }
            }
        });
        deallocator.setDaemon(true);
        deallocator.start();
    }

    @Override
    public void simpleUpdate(float tpf) {
        DoubleBuffer buffer = BufferUtils.createDoubleBuffer(524288);
        for (int i = 0; i < 300000; i++) {
            buffer.put(Double.MAX_VALUE);
        }

        //System.gc();
    }

    public static class TestAllocator implements BufferAllocator {

        enum AllocatorType {
            Default, // Use ByteBuffer.allocateDirect(size)
            Lwjgl,   // Use jme3-lwjgl3 LWJGLBufferAllocator
            JmeAlloc // Use jme3-alloc
        }

        final AllocatorType allocatorType = AllocatorType.JmeAlloc;

        final ConcurrentBufferAllocator jmeAlloc = new ConcurrentBufferAllocator();
        final LWJGLBufferAllocator lwjglAlloc = new LWJGLBufferAllocator.ConcurrentLWJGLBufferAllocator();

        @Override
        public void destroyDirectBuffer(Buffer toBeDestroyed) {
            if (allocatorType == AllocatorType.Lwjgl) {
                lwjglAlloc.destroyDirectBuffer(toBeDestroyed);
            } else if (allocatorType == AllocatorType.JmeAlloc) {
                jmeAlloc.deallocate(toBeDestroyed);
            }
        }

        @Override
        public ByteBuffer allocate(int size) {
            if (allocatorType == AllocatorType.Lwjgl) {
                return lwjglAlloc.allocate(size);
            } else if (allocatorType == AllocatorType.JmeAlloc) {
                return jmeAlloc.allocate(size);
            } else {
                return ByteBuffer.allocateDirect(size);
            }
        }
    }
}
I guess this is normal, the allocation exceeds the deallocation, and I believe the use of locks also contributes by blocking the deallocation thread, I tried your PR, the code from LWJGLBufferAllocator on the NativeBufferUtils and it also shows high memory growth until halting, that is why I asked if Lwjgl is doing something internally to allocate memory safely without crashing the memory…
That is one of my milestones, but I didn’t add it to the issues yet.
By the way, the changes are on the java code only.
If you removed this allocator, the program will run fine, until also if the allocation exceeds the dealloction, the memory will crash.
I noticed the StampedLock has a performance overhead over ReentrantLock, however, the way we use them on our allocators should be equivalent as the documentation states, I need to take a closer look at this and if even the synchronized the java object monitor synchronization will be better than both, then we should remove those primitive locks may be and use synchronized blocks instead.
EDIT:
The problem with using StampedLocks is that it requires minimum API-Level-24 (Android-7.0) which will restrict users to either using minimum Android-7 output binaries or looking for desugaring without any reason, however, if there is a great performance impact then using StampedLocks is reasonable.
I do not think so, the same test runs stable for me with both default and lwjgl3 allocators, I ran the test for about 5 minutes and retried it multiple times and memory usage was stable. With lwjgl3 It did not go beyond 1GB and GC periodically cleans memory but with jme3-alloc memory usage continues to grow until I run out of memory.
I don’t really have an answer, I need to know more information about the internals of Lwjgl MemoryUtil to proceed.
EDIT:
You know, you can use the low-level NativeBufferUtils, you could try anything you want locally on your disk if you want to investigate this.
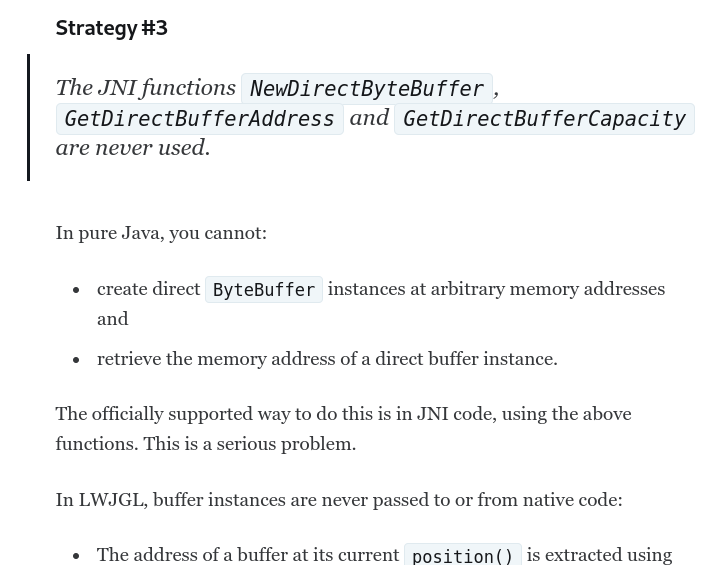
The LWJGL-3 memory management blog says that they never use the JNI direct byte buffer allocators and they rely totally on the sun.misc.Unsafe (unlike jme3-alloc which uses the official Allocators provided by JNI):
However, they also noted that they don’t support Android, and these changes are tested on Oracle, OpenJDK, and IBM JDKs and so the Unsafe may have undetectable behaviors on other untested platforms, but IDK, I haven’t used it before, however, I am trying to compile a java application with the Unsafe and the package sun.misc isn’t found unless there is a special compile option that includes the internal classes.
We also bundle the
jemalloclibrary with LWJGL. It provides the same functions as above and many more for specialized use-cases. This is the default allocator used inMemoryUtil
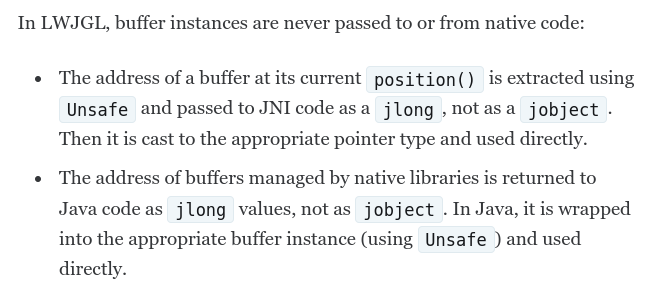
The address of buffers managed by native libraries is returned to Java code as
jlongvalues, not asjobject. In Java, it is wrapped into the appropriate buffer instance (usingUnsafe) and used directly.
This exactly seems to confirm what I said earlier.
But the greatest benefit is another and it is what differentiates LWJGL from other libraries. Passing Java objects to and from native code makes them escape, by definition. This means that escape analysis can never eliminate allocations of such objects when dealing with standard JNI code.
This seems to be the answer to why jme3-alloc behaves differently, I guess.
Edit:
Great, that is exactly how the automatic allocation works for local variables.
I guess I can relate to why they do this now, so what’s next, there are 2 options depending on the engine needs, so either we merge the current PR and then try to implement the Unsafe for the jme3-alloc-v1.0.0-stable (but this may need a few compatibility wrappers for JDKs not supporting the Unsafe and reverting back to the JNI code, and also some Android testcases) and this means the stable is not ready now and may be incorporated into jme-3.7, the 2nd option is to merge the current PR and produce the jme3-alloc-v1.0.0-stable and use it for the jme-3.6.1 (that will use the JNI allocators by default) and keep the Unsafe implementation for another version of jme3-alloc.
EDIT:
I prefer the 2nd option which will enable us to test the API in action, and users who exhibit breaks can report it back on jMonkeyEngine issues or jme3-alloc issues and they can always set the Default buffer allocator until we fix the reported issues.
It’s fine if you expect this already to be a potentially breaking change… but that automatically means 3.7 and not 3.6.1.
I don’t know what the expected risk is, though.
Is it the case that an app that was running fine before with automatic GC of its native buffers will suddenly start consuming all RAM? Because that’s what the thread makes it sound like.
The API was originally to fix and deprecate the RelfectionAllocator that was causing problems on both Android and desktop Lwjgl-2, so the patch will fix an issue, but if you think it literally internally represents a breaking change, then we should keep this for jme-3.7.
Well, I think it’s not, the testcase above is a stress test, the allocation exceeds deallocation, at least in my opinion, but in general, we cannot compare Lwjgl-3 Allocator with jme3-alloc Allocator, both use different implementations, Lwjgl-3 logic says that the JNI allocations are expensive and passes objects through the java native interface, that is why, they implemented their API using Unsafe for the best performance, however I still have no idea, if this approach will even work on Android and other untested JDKs.
Please explain what “deallocation” means in light of the fact that 99.9999999999999999999999999999999999999999% of all JME apps will not manually deallocate anything.
Do you mean some other kind of deallocation?
Note: lwjgl2 seems to be working fine for me. Not sure what the issue is.
Both the manual deallocations (using JNI deallocators or Unsafe) and the System.gc() calls will lead to calling the same internally implemented deallocator.
The internally implemented deallocator on Lwjgl-3 is different from the one that we implemented here.
Lwjgl-3 uses the Unsafe class internally which is an internal property of jdk.
This is the original issue:
Just want to recap that JME seems to not uses BufferUtils.destroyDirectBuffer() to release anything and just lets GC do it. (this is something I just recently understand). So it seems that destroyDirectBuffer method is only there for whom they want to manually do memory releasing themselves instead of Java GC and looks like no one is doing it these days anymore.
So at this point, I think there is no difference between ReflectionAllocator and PrimitiveAllocator because JME only calls allocate method on them and never calls destroyDirectBuffer. (except in TangentBinormalGenerator, and InstancedGeometry which we can ignore I believe).
So to me, it seems that we are putting too much effort into something that is not going to be used anyway!
Aside from that, I think Unsafe should not be used and I am not sure if it will even work on Android.
Also, it turns out that this is a very complex task, and as we dig in, more complex stuff shows up like escape analysis,… and I wonder if I won’t be able to help as I do not have enough information in that field so I will let someone else take in.
Used to be, Java was very bad at managing direct memory. Java6 timeframe, if you wanted to created a lot of direct buffers and let them go then you would run out of RAM unless you set your heap really small (since direct memory was not part of the heap) or unless you had a way to manually free it (thus the weird reflection stuff).
Java is really good at managing direct memory since 1.8. I create a ton of direct buffers all the time and never manually free them. That’s pretty much all Mythruna (or any block world game) is. Click a block, rebuild a bunch of new meshes. Click another block, rebuild a bunch of new meshes.
…and for me, on Java8 to 18 with lwjgl2, I have no issues. (Edit: because I don’t manually free things anymore, I guess.)