So as I figured that the Netbeans Profiler isn’t bundled with the JME SDK I went to the Plugins manager and installed the “Java Profiler” plugin.
Although it seems to be a different tool as to what they use in the mentioned tutorial, I can now monitor memory usage, garbage collection and other useful stuff while my application is running.
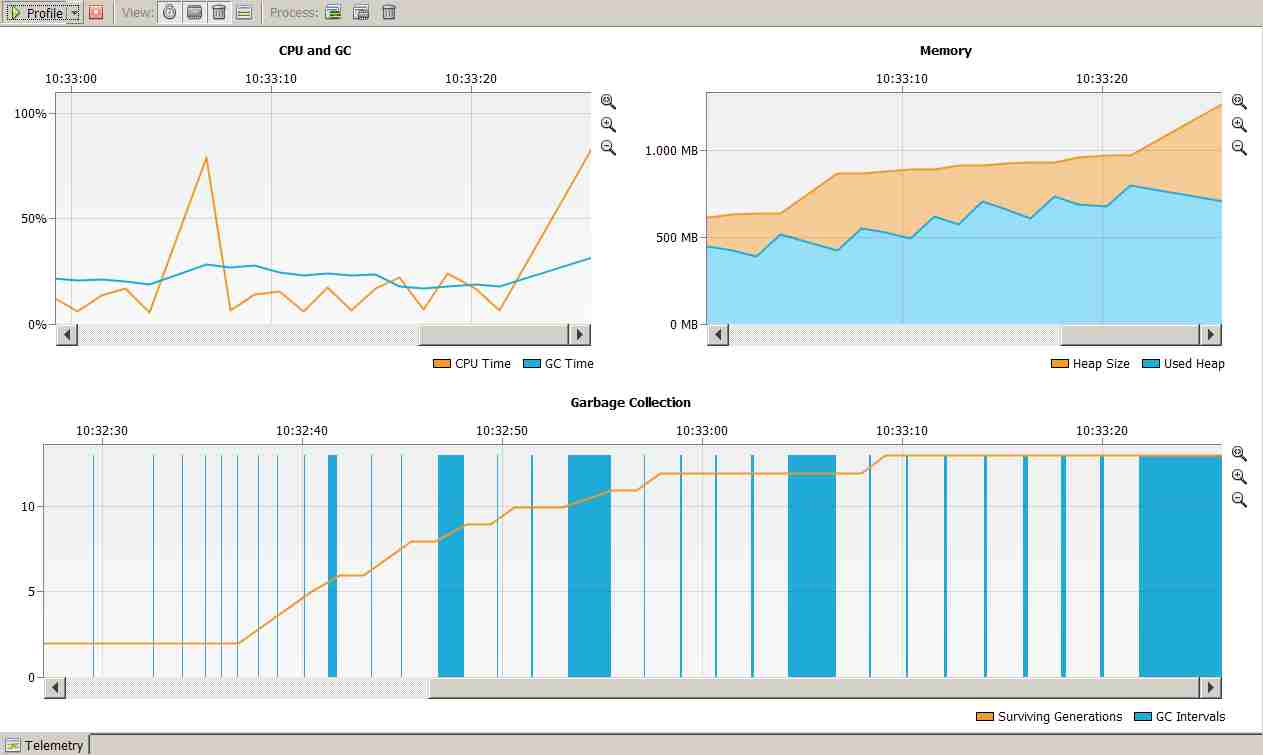
And indeed there seems to be a memory leak because after some time the number of Surviving Generations in GC is steadily increasing!
Now I want to discover the source and following the tutorial I should “Record stack trace for allocations” to give me hints about where the memory leak is coming from.
But since the Java Profiler Plugin looks very different than what is shown in the tutorial (the bundled Netbeans Profiler) I can’t find this “Record stack trace for allocations” option or even how to switch the profiling mode to “Memory Mode”.
Where can I find these options? Does anybody have experience with this tool?
EDIT:
Added a screenshot of the profiler plugin I’m using while memory is leaking.
Hmm, yep, this could explain why I need to periodically close the SDK. On my 32GB RAM (Windows) machine usually no need, but my 8GB RAM (Linux) laptop this becomes an issue real soon. Even after an hour I start to get these low memory warnings in the SDK on the laptop. So I can verify this claim, there might be something wrong with the SDK.
Oh there may be a misunderstanding here!
I’m trying to use an SDK plugin (“Java Profiler”) to actually profile my own JME game project from within the SDK! I’m neither trying to analyze the SDK itself nor do I have experienced memory problems with it.
Though one could probably use the profiler to monitor the SDK itself by targeting its process.
Sorry for not being clear enough about that.
Maybe your own projects cause low memory warnings inside the SDK?
Thanks for the hint, I will take a look at it!
EDIT:
Oh and by the way I have fixed my games memory leak in the meantime, but I’d still like to know if there is the option to “Record stack trace for allocations”. That would be very useful and could have saved me quite some time
Oh yes, sorry I just read it too quickly. Just saw memory leak and SDK and I went already to get my pitchfork and torch. Someone should do that also. I doubt it is our games that are causing it. One would think that whatever they are leaking are still cleaned up after they have stopped running.
But yes to the topic. I’ve just used jVisualVM for this. Comes with the Java SDK. Well it used to, with Java 9 they dropped it if I remember correctly. But now you can still get it from its separate project page and it is still developed.
 I just read it too quickly. Just saw memory leak and SDK and I went already to get my pitchfork and torch. Someone should do that also. I doubt it is our games that are causing it. One would think that whatever they are leaking are still cleaned up after they have stopped running.