I am currently writing a space simulation game using JME 3.1 Beta 1 together with Lemur 1.8.2.
currently I am facing the following problem with my project:
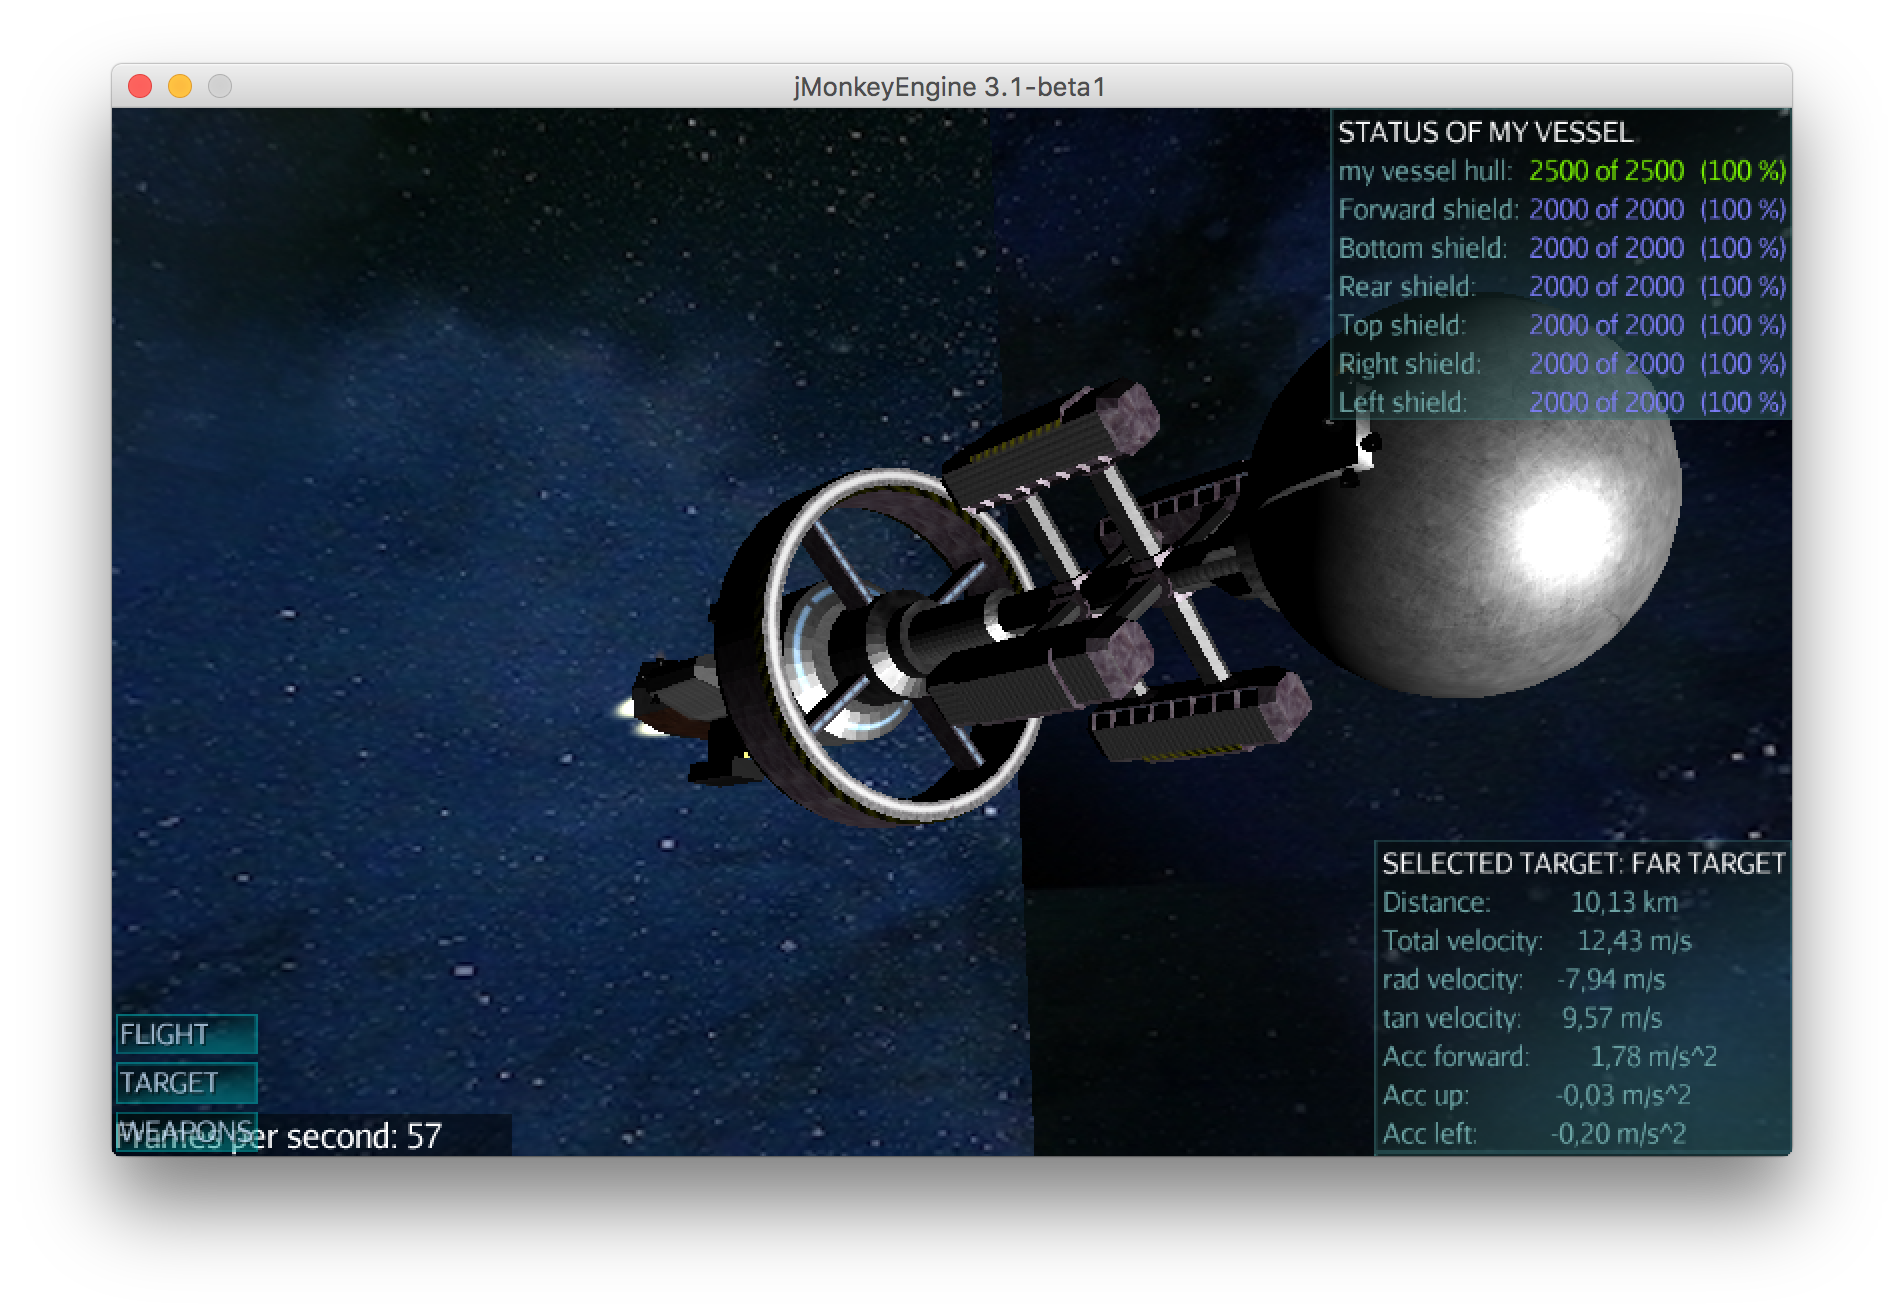
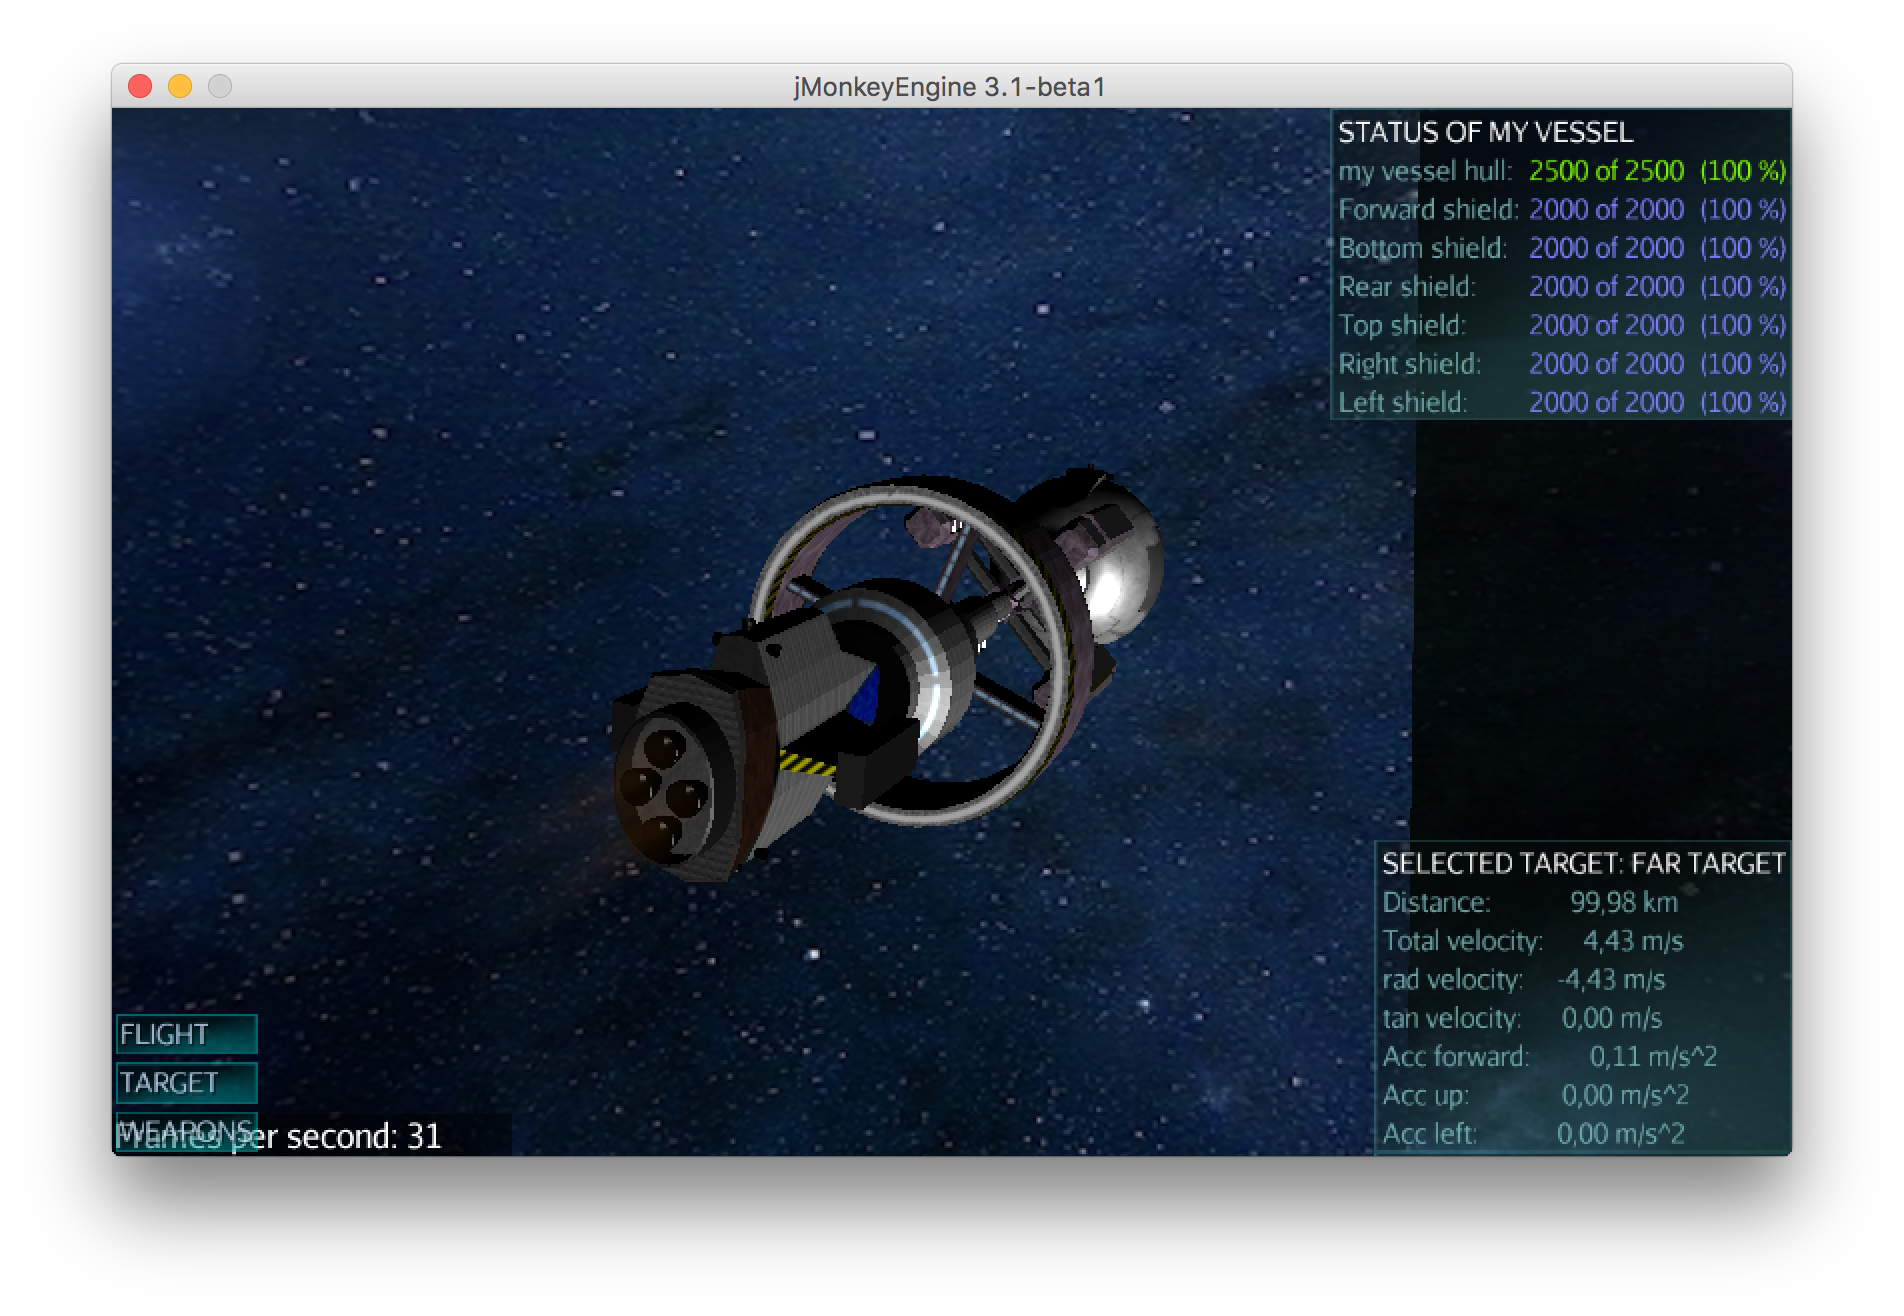
After starting the simulation frame rate starts decreasing and halves after five minutes. I started the game and watched without interaction. As you can see here I feel still lonely and silent in space so there shouldn’t be any runtime issue due to effects and audio at all. Please see the following screen shots
Being a Lemur-Newbie I cannot say on which side of the screen the issue has occurred I decided to announce it anyway here because I didn’t find a solution on my own.
Please help me solving the issue
Well, there is nothing to cause it to slow down over time unless you are somehow invalidating the GUI more often… but even then a resize should only be done once per frame for any invalidation.
This is the kind of thing that will happen if you are recreating your UI all the time and not cleaning out the old one. Else I cannot say what could be the cause.
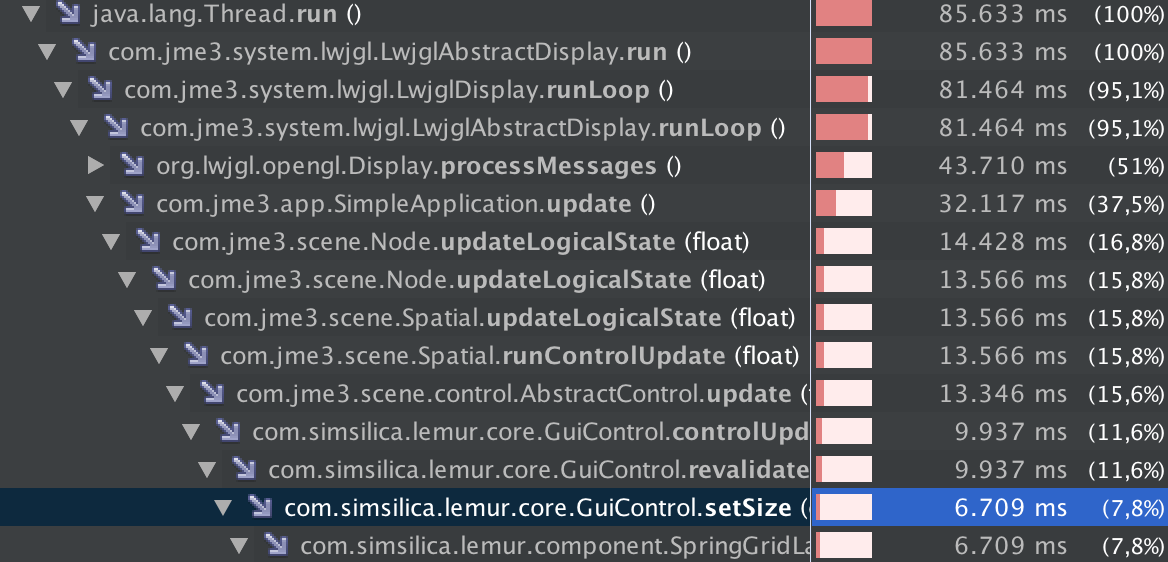
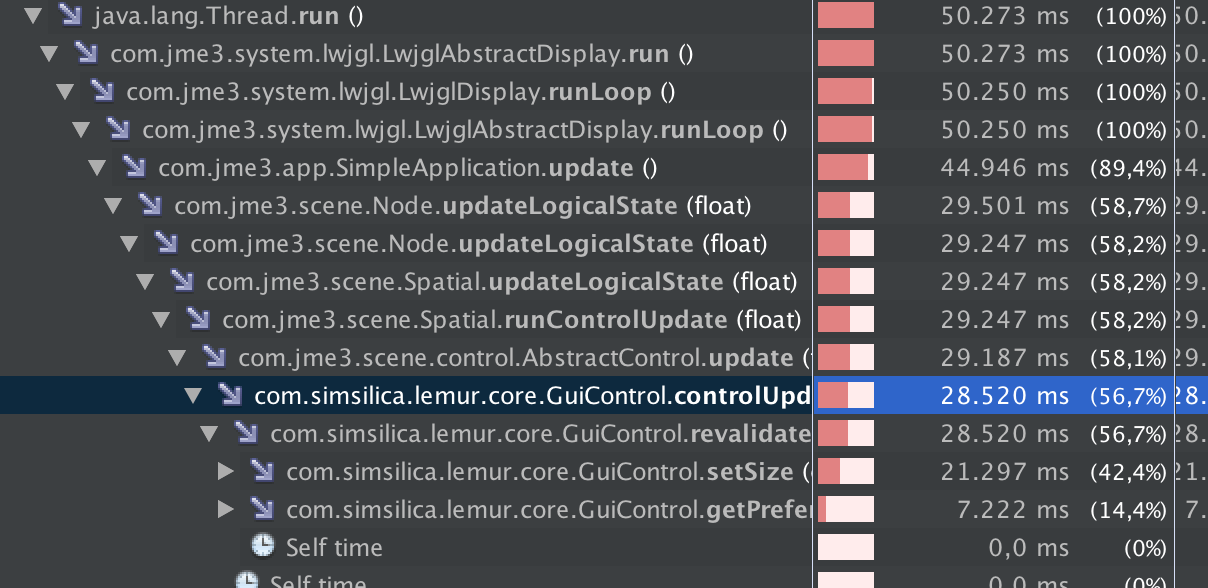
Your updateLogicalState() stack trace looks suspiciously like a JME 3.0 stack trace… which also implies an older Lemur version. Both would be interesting to know.
Edit: nevermind on that last point… though I’m not sure why your stack is deep instead of flat because updateLogicalState() was optimized some time ago.
thanks for the quick reply. In fact I used Lemur 1.8.2 when I generated the stack traces. Although the same issue remains with the newer version of Lemur 1.9.1 which I have already tried after the report (same result).
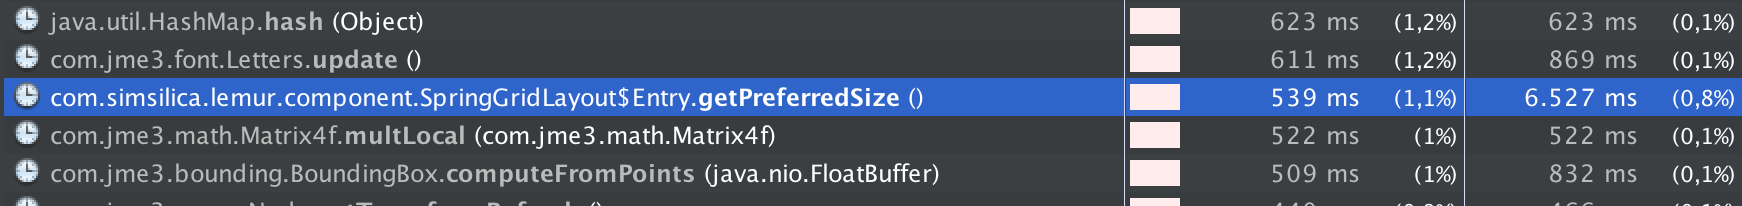
I have also checked the memory consumption of the objects by creating a heap dump. Here I found out, where the issue originates.
It comes from the GuiControl object attached containing the springGridLayout with over 16 millions HashTable entries. These are generated in this code fragment of the GUI class:
/**
 * Read from slave target every frame and update GUI.
 *
 * @param slaveOpt
 */
@Override
public void dataUpdate(Optional<Spatial> slaveOpt) {

    Optional<Spatial> observedSpatial = slaveOpt
            .flatMap(slave -> concat(Stream.of(slave), allParents(slave))
                    .flatMap(sl -> controlAsStream(sl, SpaceObjectControl.class)).findFirst())
            .map((SpaceObjectControl soc) -> soc.getSpatial());

    // Collecting damage control objects which are associated
    // with the slave spatial and its children.
    List<DamageControl> dCtrls = new ArrayList<>();
    observedSpatial.ifPresent(sp -> sp.breadthFirstTraversal(subs -> {
        DamageControl dc = subs.getControl(DamageControl.class);
        if (dc != null) {
            dCtrls.add(dc);
        }
    }));

    if (dCtrls.isEmpty()) {
        // topLevel contains all the gui elements. It is used for easily dynamically
        // switching the gui on and off. this is archived by attaching and detaching.
        // If the targeted object is not damageable (contains no damage control objects)
        // then the gui is omitted in order to clean up the view.
        super.detachChild(getTopLevel());
    } else {
        // Here the problem originates: I was thinking that adding the child
        // is no problem because the child is already attached. But HAshTable entries
        // in SpringGridLayout are generated here every frame.
        super.addChild(getTopLevel());
        headline.setText(STATUS_HEADLINE + observedSpatial.map(Spatial::getName).orElse("--- NO TARGET SELECTED ---").toUpperCase());
        IntStream.range(0, dCtrls.size()).forEach(line -> setTextToGrid(textGrid, line, dCtrls.get(line)));
        IntStream.range(dCtrls.size(), 10).forEach(line -> clearTextFromGrid(textGrid, line));
    }

    this.slaveOpt = slaveOpt.orElse(null);
}
…just on quick read, very suspicious that you are calling addChild() to add something to the layout but only calling detachChild() to remove it… thus leaving it in the layout.
Multiple attachment of the same object must be avoided because this leads to multiple map entries in the SpringGridLayout object of the GUIControl.
Multiple calls of removeChild don’t matter.
I have changed the code as follows:
@Override
public void dataUpdate(Optional<Spatial> slaveOpt) {

    Optional<Spatial> observedSpatial = slaveOpt
            .flatMap(slave -> concat(Stream.of(slave), allParents(slave))
                    .flatMap(sl -> controlAsStream(sl, SpaceObjectControl.class)).findFirst())
            .map((SpaceObjectControl soc) -> soc.getSpatial());

    List<DamageControl> dCtrls = new ArrayList<>();
    observedSpatial.ifPresent(sp -> sp.breadthFirstTraversal(subs -> {
        DamageControl dc = subs.getControl(DamageControl.class);
        if (dc != null) {
            dCtrls.add(dc);
        }
    }));

    // Now I always remove the child each cycle. Multiple removal doesnt seem
    // to be a problem here. It is only reattached if and
    // only if there are DamageControls available to display.
    // ----------
    // AVOID calling detachChild!
    // ----------
    super.removeChild(getTopLevel());
    if (!dCtrls.isEmpty()) {
        super.addChild(getTopLevel());
        headline.setText(STATUS_HEADLINE + observedSpatial.map(Spatial::getName).orElse("--- NO TARGET SELECTED ---").toUpperCase());
        IntStream.range(0, dCtrls.size()).forEach(line -> setTextToGrid(textGrid, line, dCtrls.get(line)));
        IntStream.range(dCtrls.size(), 10).forEach(line -> clearTextFromGrid(textGrid, line));
    }

    this.slaveOpt = slaveOpt.orElse(null);
}
Result → frame rate remains at 60 FPS (screen refresh rate) → fixed:


 I decided to announce it anyway here because I didn’t find a solution on my own.