Well, I wanted to share some debug utilities I made.
It is separated per category and AppStates, which includes:
- Mesh debugger - Gives many different views: wired, wired with random colors, flat with random colors, “normals colors”…
- Normals debugger - Shows the normals with lines or arrows.
- Bounds debugger - Shows the bounds of the given spatials.
- Skeleton debugger - Shows the skeleton bones with lines (using internally the skeletondebugger).
This debugs are meant to be used with a given spatial (which can be the rootNode, so the whole scene). They are also auto-updated (what means, if any spatial is attached to the debugged one or it subtree hierarchy, it is automatically debugged too).
Additionally there is also an “asset reloader”, which automatically tracks material files changes and reload them. This is to be changed to a “debugger appstate” too but… is not currently done xD.
How to use them
In the repository there is also a DebugCommand, which is how I use it, but basically attaching a new instance of the desired debugger with the wanted paremeters to the stateManager. (However, all this states rely on a global properties state, which gives them some needed common things, such as the debugged spatial, the rootNode being use, a thread pool, etc).
¿What do this has to do with lemur?
Frankly… not much  , but ey!, these are better if you can use them in-game, on runtime, so a kind of console is needed, and there is where lemur appears. In that repository there is also other panels:
- Console - It shows a visual console to enter commands or display logs (or both). This one is located on the top of the screen and being as wide as it.
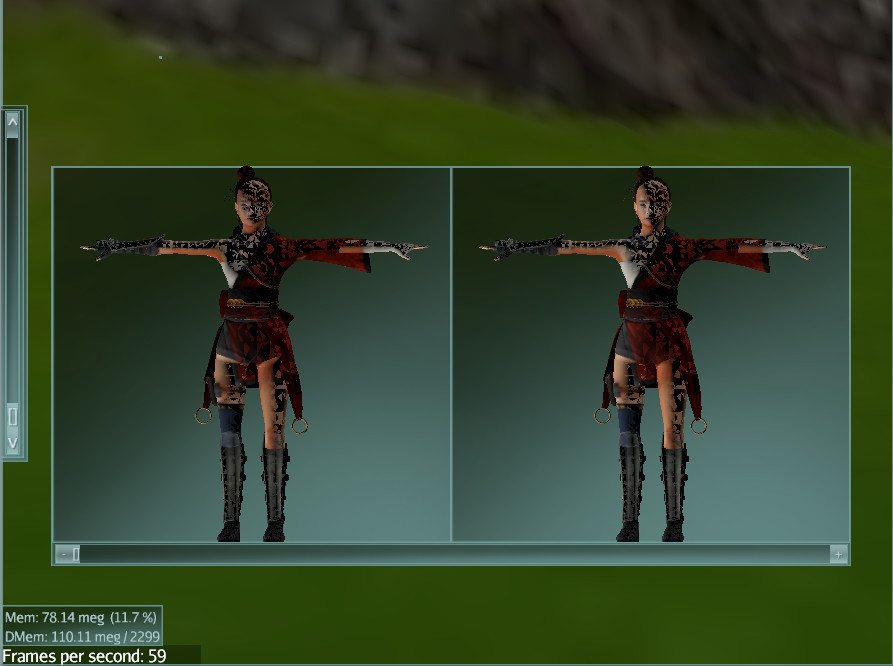
- Viewport Panel - It’s a Just-Attach-Like-Another-Lemur-Component panel, which have the behavior of a panel but with the peculiarity that shows a viewport instead of a background (the JALALC is a bit tricky, as the panel attaches a control to the root node of where it is attached, normally the guiNode, and checks every frame for a change in it farthest ancestor. If it isn’t the same, it removes the viewport).
- Viewport2D Panel - Extents the former (which shows a 3D viewport) but showing a 2D scene (just as the gui-node), which is very useful to add more panels inside and have “clipping”.
¿Are this things bug-proof?
They work well for us 
Extra things
In the repositories there are many other “utilities”, some more useful than others xD. Ok, neither of them too useful, but there is one to mention, the “MergeUtil”. We use this one to merge many objects with different geometries and skeletons/animations into a single one with all it bones and animations… it may sound strange (think on a wearing system) and what is sure is that is cpu-intensive enough to expect a small fps drop when using it.
A picture is worth a thousand words
Some of the options looks like:
Debug selected (normal arrows)

Combined debug (flat colors + normal lines)

Debug bounds (nodes = yellow, geometries = green)

Lemur viewport panels (left → 3D viewport, right → 2D viewport)


