[SOLVED] Fps drop artifacts

I have an issue with sudden fps drops happening randomly (once per minute or two). Typical fps is around 200-300 in both windowed/fullscreen modes. Where exactly it happens that’s the next story (I didn’t investigate it much yet), but what I’m curious of is that

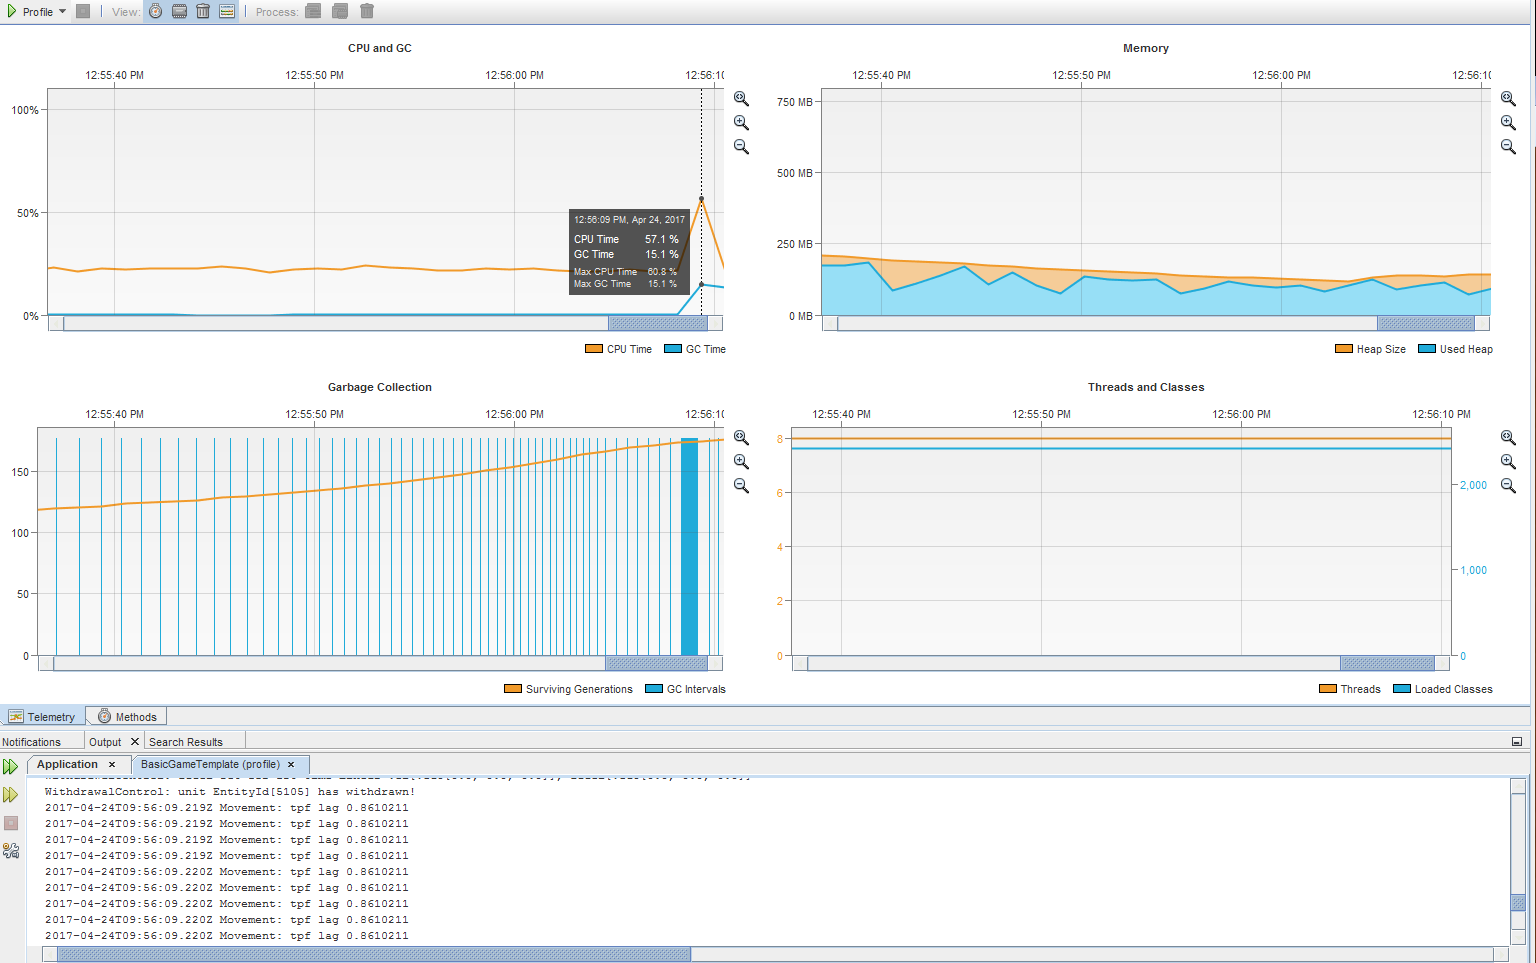
  1. It’s not shown on screen jme stats - even when it’s lagging it shows same 200-300 fps. I intercepted it in movement system though by printing tpf value if it exceeds 0.1 and

  2. I got number of continuous rows like

Movement: tpf lag 0.7714908

So how I got that same value multiple times - that means that the system iterated many times during that same huge frame? I mean I didn’t spawn it in separate thread or something.

  1. I noticed a strange effect that looks like all the vectors slightly enlarged after the lag. Like some compound object that consists of two contacted pieces (one is part of another and set with its own Vec3d translation from parent’s origin) after the lag becomes placed at some tiny distance (while geometrically in the right side/orientation) and not contact the parent anymore. After the second lag the distance increases and so on. So goes with the velocities.

So I’m curious about how that all relates, especially how mathd magic handles big (probably unplayable in practice) tpf values? Or am I looking at the wrong place? Thanks!

Is that GC and stop-the-world?
Try to use any profiler, look if those lags occurs while the GC is working.

1 Like

Not sure why mathd would care about large tpf values.

I read this three times and it still doesn’t make sense to me. Sorry.

Most important things he wrote in first paragraph.

Like on the picture: left is the start (thick arrow on bottom is object that is part of sphere, arrow to the right is the velocity), in the middle is the look after 1st lag, on the right is after 2nd lag and so on.

Ok, I’ll try to investigate more.

What is stop-the-world?

So, if it is really a stop-the-world, then you have some problem with too many memory allocation. You can try to switch to other GC algorithm, the one I prefer is Concurent Mark Sweep GC.

1 Like

Ah, ok, I’ll be back once I check.

I just had a similar issue (similar symptoms, anyway), which I believe was due to my creating (and discarding) way too many objects. Switching to re-using objects (just happened to be a consistent number) made these tpf spikes go away completely. I didn’t really expect that result, at least not such a dramatic one, but that’s what the log (and the visuals) showed…

2 Likes

It greatly depends on the type of objects you are creating and throwing away and whether or not you are running incremental GC, etc.

Seems that in my system profiler plugin works only partially (I can get Telemetry and Threads, but can’t get Methods or Objects stats - looks like it doesn’t redraw the canvas when it’s done so it’s just empty). Anyway, yes, it’s GC time

And default strategy is Parallel (Java 1.8, JME 3.1).

Try with concurrent GC, check your code and try to remove unnecessary allocations. Keep objects for reuse instead of losing references and creating new objects.

1 Like

I cant See it on mobile but it seems the Heap Size Never goes above 200mib? Also try -Xmx1g because no gc helps if you just have too much Data and Not enough ram headroom

Rhe high gc frequency and the fact that gc doesnt help much could indicate that this is the Problem. If you have faulty Code your Lags will only be less frequent. Still Check what is consuming the Memory through profiling though

1 Like

ConcMarkSweep reduced lags quantity sufficiently, thanks! Heap Size this way was less than 150Mb.

Initial and max heap size were above that, it just went down to that level by the time lag occured.

I still have to investigate profiler issue and my code, for sure.

Still, I can notice that vector enlargement effect. Like on the picture

The red vector pictures arrow object’s placement (relative to the sphere object), and it’s never changed in code after object’s creation. But as time goes its length increases (the less the lag the lesser, but still), so this makes me think that something wrong happens to Vec3d reference at some point. As in ModelState view it’s just one setLocalTranslation() call.

Well, something is moving it. A Vec3d won’t move itself. So some code is changing its value.

I guess this can be it:

newfacing.addScaledVectorLocal(facing.mult(rotVel), tpf);

Since this:

public final void addScaledVectorLocal( Vec3d v, double scale ) {
        // Represent the vector as a quat
        Quatd q = new Quatd(v.x * scale, v.y * scale, v.z * scale, 0);
                
        q.multLocal(this);
               
        x = x + q.x * 0.5f;
        y = y + q.y * 0.5f;
        z = z + q.z * 0.5f;
        w = w + q.w * 0.5f;
} 

when takes big scale, sometimes produces this:

Movement: newfacing Quatd[-0.006899065070973209, 0.39415884579089233, -0.19969383107198557, 1.1031962777707636]
2017-04-24T16:16:08.491Z Movement: tpf lag 0.8191591 for EntityId[5046]
Movement: newfacing Quatd[-0.23556374182146173, 0.10576603325710535, -0.030440212531902197, 1.084289683426932]
2017-04-24T16:16:08.491Z Movement: tpf lag 0.8191591 for EntityId[439]
Movement: newfacing Quatd[0.024322940625116918, 0.2823448149407954, -0.1556059616191287, 1.1435930355740431]

which is then converted like this:

public Quaternion toQuaternion() {
        return new Quaternion((float)x, (float)y, (float)z, (float)w);
}

and then used in ModelState for placement.

Note: there is not a physics engine in existence that’s going to be happy with large random time steps. All kinds of bad things will happen.

Why is your physics thread lagging so badly? You are better off feeding it always a fixed time step and letting the players experience the lag, I think.

1 Like

Well probably because my code is ugly and the system doesn’t have a dedicated thread yet. I’ll investigate that further, I was just curious where that visible effect came from. Would be nice to have a hint what step would you recommend for that? 15-20ms?

I’ve used 60 hz, 50 hz, and 20 hz without issue… just depends on how well you want non-swept collisions to work.

1 Like

Ok, dear sirs, thank you all for your help! I think we can consider this solved for now.

Edit: funny thing is I gave it a 50 Hz own thread and the error is still coming from somewhere

Movement: tpf 0.02 newfacing Quatd[0.12626906405780391, -0.09998820472255082, -0.006410284513997642, 1.0002848115822793]
Movement: tpf 0.02 newfacing Quatd[0.11933024232018298, -0.10620966264058766, -0.007890808321053053, 1.000529337478131]
Movement: tpf 0.02 newfacing Quatd[0.11237985708439073, -0.1124229807796248, -0.009370904172794741, 1.000687051572467]

and accumulating.
I’m not creating quats from x,y,z,w directly anywhere, where in blazes this can come from :no_mouth:

Edit2: looks like my angular velocity components were misformed. Taking them as just dots didn’t remove resulting weirdness completely, I’m still getting sometimes

Movement: tpf 0.02 facing Quatd[0.03675525829663143, 0.06623293824989239, 0.028908417884580696, 0.9996748835705744] rotVel Vec3[-1.0, 0.0, 0.0]
Movement: tpf 0.02 newfacing Quatd[0.026699295737501395, 0.06594214173927813, 0.029574670441455172, 1.0000446132770586] for EntityId[50]
Movement: tpf 0.02 facing Quatd[0.026699295737501395, 0.06594214173927813, 0.029574670441455172, 1.0000446132770586] rotVel Vec3[-1.0, 0.0, 0.0]
Movement: tpf 0.02 newfacing Quatd[0.016638596060344554, 0.0656446131356418, 0.03023806492936047, 1.000313214889867] for EntityId[50]
Movement: tpf 0.02 facing Quatd[0.016638596060344554, 0.0656446131356418, 0.03023806492936047, 1.000313214889867] rotVel Vec3[-1.0, 0.0, 0.0]
Movement: tpf 0.02 newfacing Quatd[0.0065741756802913075, 0.06534037982911496, 0.030898533043195998, 1.000480620281291] for EntityId[50]
Movement: tpf 0.02 facing Quatd[0.0065741756802913075, 0.06534037982911496, 0.030898533043195998, 1.000480620281291] rotVel Vec3[-1.0, 0.0, 0.0]
Movement: tpf 0.02 newfacing Quatd[-0.0034929479935116876, 0.06502946990524508, 0.0315560067326394, 1.0005467715272873] for EntityId[50]
Movement: tpf 0.02 facing Quatd[-0.0034929479935116876, 0.06502946990524508, 0.0315560067326394, 1.0005467715272873] rotVel Vec3[-1.0, 0.0, 0.0]
Movement: tpf 0.02 newfacing Quatd[-0.013561756660119132, 0.06471191214271478, 0.03221041820924368, 1.0005116209216085] for EntityId[50]
Movement: tpf 0.02 facing Quatd[-0.013561756660119132, 0.06471191214271478, 0.03221041820924368, 1.0005116209216085] rotVel Vec3[-1.0, 0.0, 0.0]
Movement: tpf 0.02 newfacing Quatd[-0.02363123122919856, 0.06438773601098867, 0.03286169995351502, 1.0003751309889126] for EntityId[50]
Movement: tpf 0.02 facing Quatd[-0.02363123122919856, 0.06438773601098867, 0.03286169995351502, 1.0003751309889126] rotVel Vec3[-1.0, 0.0, 0.0]
Movement: tpf 0.02 newfacing Quatd[-0.03370035192362549, 0.0640569716678878, 0.03350978472197047, 1.000137274496849] for EntityId[50]

but now it’s not accumulating (disappears by itself) and not visually recognizable anymore. So not just “not any possible tpf is suitable”, but also not any rotVel. This Vec3d is just a container, not vector in geometrical sense, that’s something I forgot at some step.