[SOLVED] Loading and unloading map tiles as the location changes

I have a scene updater that dynamically loads/unloads map tiles around a subject, as it moves through the world. The tiles are PNGs, no alpha, stored on disk. There are over 10,000 tiles, and the subject would typically cross tile boundaries every ~10 seconds. I keep 9 tiles loaded around the subject at any time in my Android app, but the problem is growing native memory in Android profiler (the problem may not be android-specific, just surfaces easier in a more memory-constrained device). What follows is potentially a crash (out of memory), black tiles showing randomly at runtime, etc.

So I thought I should avoid allocating memory every at boundary crossing and instead change the underlying image data at runtime, on a pool of geometries that I initialized:

val texture = assetManager.loadTexture("tile1.png")?.apply {
    anisotropicFilter = 4
}
val geometry = Geometry("tile_$i").apply {
    mesh = Quad(quadSize, quadSize) // actually, the PNGs are 1024x1024
    material = Material(assetManager, "Common/MatDefs/Misc/Unshaded.j3md")
        .apply {
             setTexture("ColorMap", texture)
        }
}
// add `geometry` to pool...

which repeats for the pool size. Even without the pool, I was loading the PNGs in the same way except I would create a new Geometry/Texture every time. Instead, I now keep references to 9 Geometry objects along with their textures and at runtime change the image:

assetManager.locateAsset(TextureKey("the_new_tile_to_load.png"))
    ?.let { image ->
        recycledTexture.image = image
    }
// repeat for the 9 tiles
// re-position Geometry objects around the subject as needed

But I still get OutOfMemory eventually, presumably because the old texture.image data would still be allocated? (And on Android some of the images loaded this way won’t even show… seems to work on desktop though).

What am I missing here, and would this be the right approach to load/unload the PNGs? Given I can load the new image content as a ByteArray, when the subject crosses a tile boundary, how can I re-use the previously-allocated bytebuffer and set the new image data?
Would I instead tackle this differently and try to deallocate the native memory?

Thanks in advance.

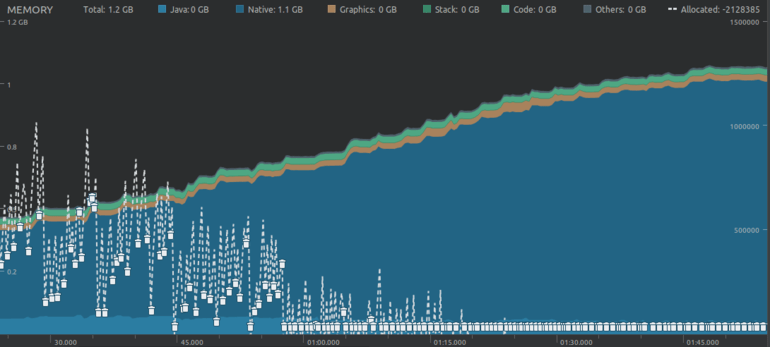
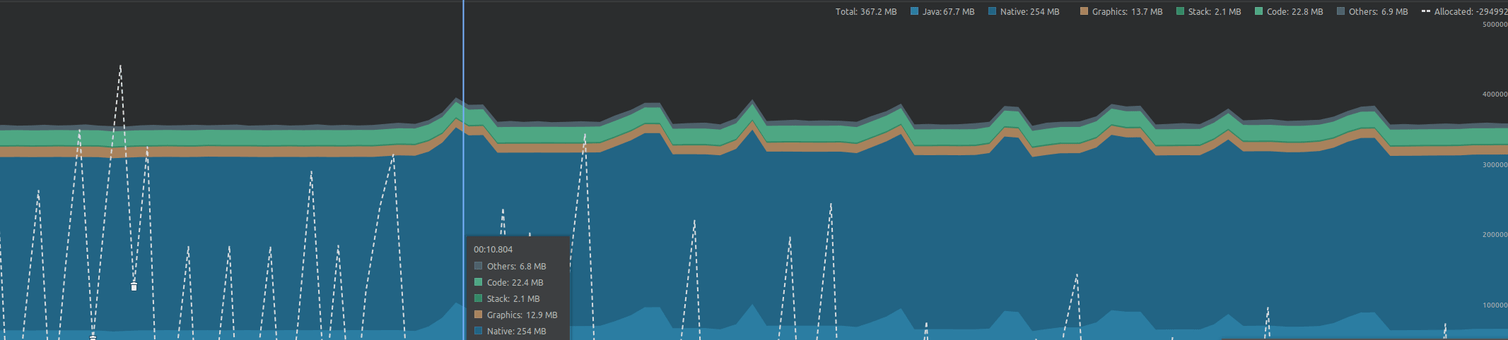
Memory profiler - native memory increasing over time:

Seems your approach is okay, but something is missing in practice. I’m using @pspeed’s excellent Sim-Ethereal framework to handle zones and filtering of the view on the client-side. Works like a charm.

Can you make an executable code sample which repeats this OOM problem?

Does the same issue happen only on android or does it also happen when running in desktop?

The AssetManager is caching everything that’s loaded. It is using weak references and should release them automatically… but maybe this doesn’t work properly on Android?

You could try manually clearing the cache entries, I guess, just in case.

I reproduced on the desktop too (in fact this code is imported in an Android app as a library/jar, so the OOM would surface more easily). After running the library standalone in a desktop app, and limiting the JVM heap size to -Xmx500m then I can reproduce the OOM:

java.lang.OutOfMemoryError: Direct buffer memory
at java.nio.Bits.reserveMemory(Bits.java:695)
at java.nio.DirectByteBuffer.<init>(DirectByteBuffer.java:123)
at java.nio.ByteBuffer.allocateDirect(ByteBuffer.java:311)
at com.jme3.util.ReflectionAllocator.allocate(ReflectionAllocator.java:178)
at com.jme3.util.BufferUtils.createByteBuffer(BufferUtils.java:982)
at com.jme3.texture.plugins.AWTLoader.load(AWTLoader.java:121)
at com.jme3.texture.plugins.AWTLoader.load(AWTLoader.java:183)
at com.jme3.texture.plugins.AWTLoader.load(AWTLoader.java:192)

I was wondering how come limiting jvm heap size surfaces this exception on desktop - would that limit process’ native memory too?

I also tried assetManager.clearCache() every time I am loading new assets, but it doesn’t seem to fix it - perhaps there is no problem with the asset cache - that would have a fixed capacity right?

Thanks all.

How many different assets do you load?

In the java profiler it also tells you the amount of objects created and what they are. Could it be that you have run-away objects somewhere that are not being removed properly?

The garbage collector will dump objects with no reference, and this is usually seen by experiencing noticeable “stops” in the game if you create a ton of throw-away objects, but it seems the collector can’t find any memory to free, so these objects must be referenced somewhere…

The profiler should give you an idea of what’s going on here.

2 Likes

Just a couple other things from my experience with android dev.

“Works on desktop, weird on device” sometimes exposes race conditions. Make sure you’re synchronising properly.

You could load the entire level in a single image and use an image raster to read segments of it that you need as the world progresses.

You can limit your loop update rate. A lot of the time updating at say 60 or even 30 times a second is fine, like for GUI. On mobile devices this frees up a ton of cycles.

Try using 'assetManager.deleteFromCache(texture.getAssetKey())' instead - and ensure that all references to that Textures (or model, material, etc) have been cleared, and also detached from the scene completely before clearing an asset from the cache.

Using .clearCache() runs the risk of clearing an asset (or usually many assets) from the cache that is (or are) still attached somewhere in the scene - and then you will still be using the memory, but will no longer be able to forcibly delete that Asset from the cache if you need to - and will also have to re-allocate the memory space the next time you load that asset since the assetManager lost its reference.

In my experience making my own tile pager, I found that I needed to always call the AssetManager.deleteFromCache(AssetKey) method after clearing all of my own references to an asset in order to avoid the DirectBuffer OOM error and get things to work.

1 Like

Thanks all. Here are some updates:

  • the desktop out-of-memory error must have been due to memory fragmentation. It would only happen if limiting the heap size to something smaller after all, e.g. -Xmx500m. Moreover, I tried but was not able to reproduce in a new, separate desktop application just by repeatedly loading textures. This suggested the problem really would be on the android side
  • for recap, the android application kept having the native memory leak when running that same map tile code as the desktop application (loading/unloading different map tile textures every ~10 seconds as the character moves around the map)
  • the android application was using com.jme3.texture.plugins.AndroidNativeImageLoader which caused the native memory leak, as visible in the chart in my opening message in this thread
  • the deprecated com.jme3.texture.plugins.AndroidBufferImageLoader uses Bitmap objects (heap) to create the Image, instead of native buffers. When plugged into the android application, the memory usage is significantly more stable:

To conclude, it seems that using the android native image loader is not currently possible due to leaky native buffers. Instead, it’s possible to get around that by changing Android.cfg to use the deprecated class instead:

LOADER com.jme3.texture.plugins.AndroidBufferImageLoader : jpg, bmp, gif, png, jpeg

Next step is to keep profiling with AndroidBufferImageLoader.

1 Like

On:

After trying it out and profiling, there would still be (heap) memory leak, probably because of the cache. I followed your advice above to first detach nodes from the scene followed by assetManager.deleteFromCache(textureKey) - I would keep references to the loaded textures until it’s time to unload. That works as required now and I can use this solution for now!

2 Likes