I have a strange issue that my game uses more and more time per frame the longer it runs. I made a quick die cycle where a level gets destroyed on death and reloaded.
My states and systems are stable and do not need more and more time but the Render Main and Post View Ports need more and more time. After 2 hours the FPS logically drops down to 30.
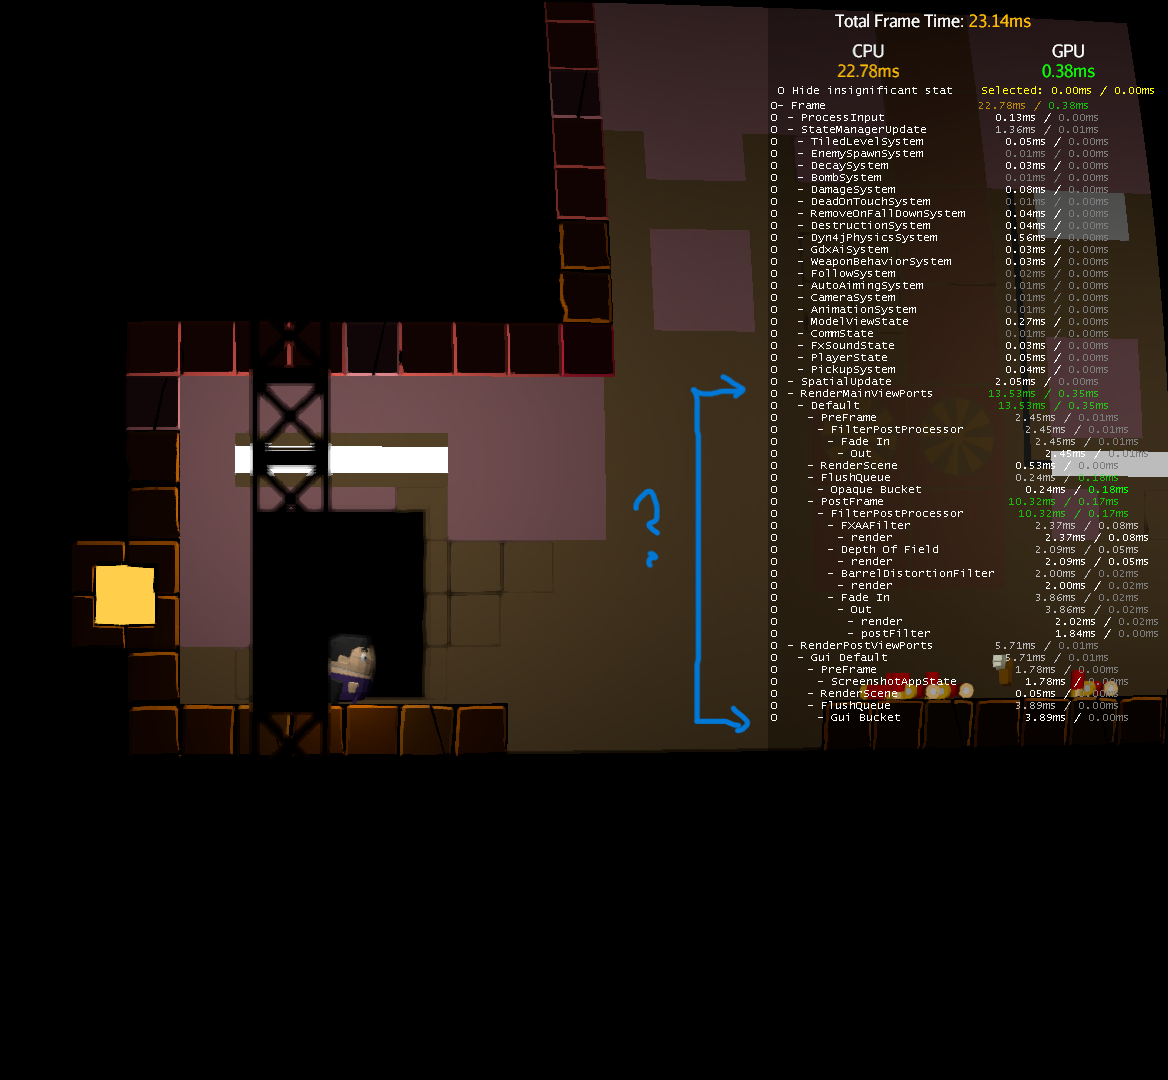
Any hints where I could look to find what uses up the time in these renders? I have a clone of the detailed stats state and tuned it a bit for me (display only states/systems that at least need 0.01 ms). Any help is appreciated, also if you have ideas what else I could log…
It’s conceivable that the number of filters is growing over time, with filters being added but not removed, or that the scene graph complexity is growing over time, with spatials being added but not removed. Do the StatsAppState (F5) numbers show any trends, or are they stable?
It does sound like some resource isn’t getting managed correctly (either in your code or JME’s). Short of going through every bit of things you add (scene processors, viewports, etc.) and making sure they are all removed again… maybe you could try commenting out features until the problem goes away.
It would at least give you a starting point to narrow it down.
Yes, that’s sort of what I do. I started to log every 20 sec all my internal lists, maps and arrays. Added now as well the list of filters, view ports, etc. and all values are stable (I found 2 sources tho, so it is for sure worth my time :))
I kicked out all my filters (fade out, blur, fxaa, depth, and barrel distortion)
I’d suggest using the two profilers. The cpu profiler and the memory profiler. One (or both) of those will probably dig up something interesting. Hopefully the cpu profiler will show an obvious culprit using all the cpu time, but failing that the memory profiler will allow you to see what objects are building up (i find cpu profiling easier so id start with that).
Many IDEs have built in profilers (e.g. intellij does)
Edit; upon checking I see only intelliJ paid edition has the profiler. Still might be worth grabbing the free trial to use it
This is really weird, as your stats state is showing specifically that the majority of your time is being spend it the render portions of those filters.
I’d second VisualVM for digging into what is in memory. Maybe trigger a heap dump early in the run, and then again when things have slowed down. Look for types (classes) where the object count has risen significantly. It also has a thread monitor/thread dump functionality that might help to figure out exactly where in the call stack time is being spent.
After I spend days on this problem (and found 4 leaks in my own code) and nothing solved it, the remark from @pspeed that it might be something with the engine finally did the trick, I just upgraded jme from 3.5.2 to 3.6.1 and so far it run over night without slowing down (before it was unsusable after 2hours).
I do some more testing, but I think it’s resolved.
Thanks to everyone for the pointers and tools, I learnt a lot.