Continuing the discussion from Updating Display Settings Darkens Scene:
So, I ran your test case on my end, and I made a few observations:
- The screen blank only seems to happen on the jme3-lwjgl3 library when messing with the “setRenderer” option in the app settings (specifically, setting it to any OPENGL version 3 or 4). Setting it to OpenGL 2 or not setting it at all doesn’t seem to blank it (although colors will still darken)
- A regular context restart won’t trigger anything normally on the jme3-lwjgl library. However, setting stencil bits, depth bits, bits per pixel, or samples prior to the restart will trigger any of the above behavior (darkening colors on OPENGL2 compatibility, screen blanking on OPENGL 3 or 4 compatibility).
- The darkening barely affects color channels close to the maximum
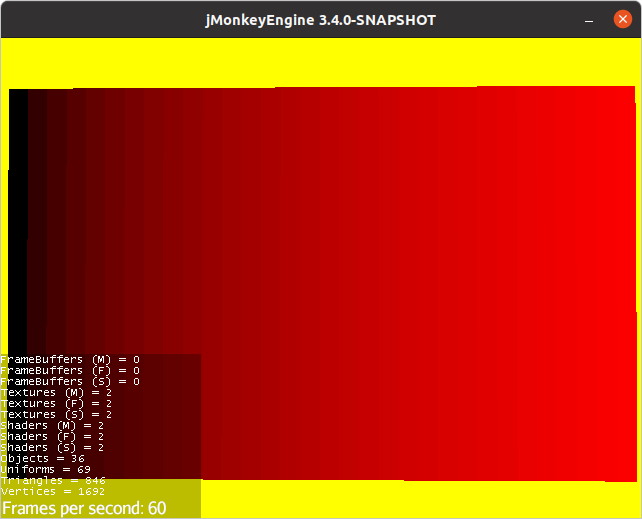
Before:
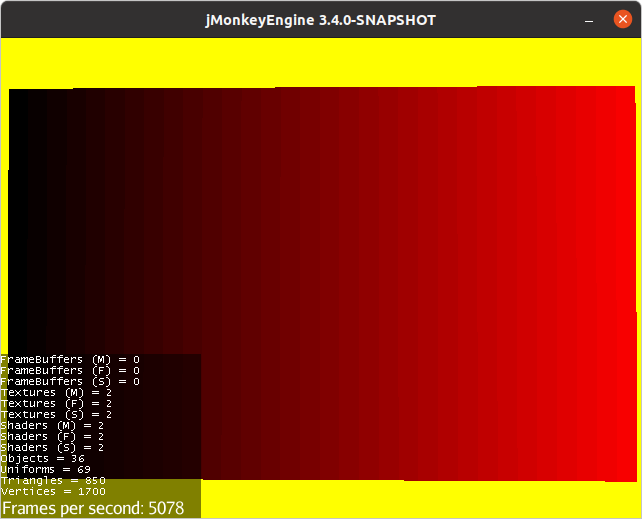
After:
There does appear to be a difference, but it is nearly imperceptable. It only really begins to take effect on lower values of the color channel.