Hi monkeys, hope you all have good days.
I’ve been learning JVM for the last few weeks. Because I’ve developed a program that uses a lot of memory. I suspect that there’s a memory leak.
The project is a Snake game, I start it one year ago, just after I learned Zay-ES.
Github: GitHub - jmecn/Snake: 贪食蛇大作战
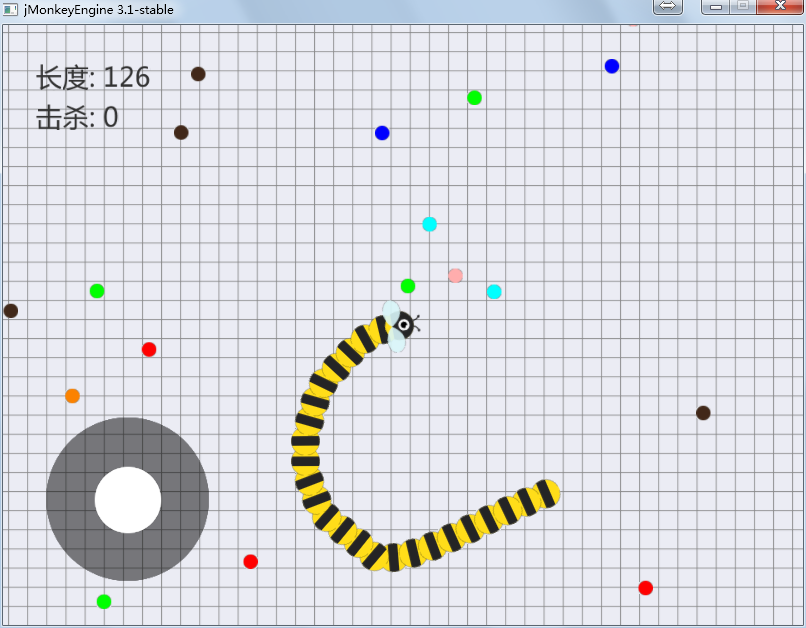
This project’s memory usage is very large. It starts with at least 100 MiB, with the increase in running time and memory consumption is more and more big. 5 minutes later, almost 1 GiB of memory was consumed.
I guess the problem is caused by the creation of a large number of object instances when Zay-ES works. GC recycling is not timely, resulting in these objects have been retained in the heap memory. For this reason, I think the Zay-ES framework has memory leaks , and eventually abandoned the project.
I’m wrong.
The fundamental reason is that I didn’t set up the heap memory of JVM, so that’s the result.
Here is my analysis process:
My environment :
- OS: Window 7 SP1 x64
- CPU: Intel Pentium G860 3.00 GHz
- RAM: 4.00 GiB
- IDE: Eclipse Neon (4.6)
- JDK 1.8.0_66
I use Visual VM to watch heap memory usage. I find it in %JAVA_HOME%/bin/jvisualvm.exe .

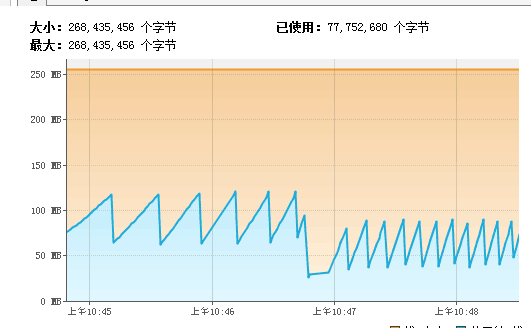
This figure showing the heap memory usage before I do anything to JVM.
- 堆 means Heap
- 字节 means Bytes
- 大小 means Size
- 最大 means Max size
- 已使用 means Used
- the YELLOW line is heap space size.
- the BLUE line is the used memory.
As you can see from the figure above, the minimum memory required for this program is less than 50 MiB. As there is no heap size limit, JVM “thinks” it can use as much memory ( may be 3 GiB ) as possible, so GC has a very low frequency of execution. The GC is only executed once the used memory is close to the upper limit of heap memory, and the upper limit of heap memory is expanded at the same time.
In the figure above, the memory peak has been close to 250 MiB, so I decided to set the capacity of the JVM heap to 256 MiB to see what the difference would be.
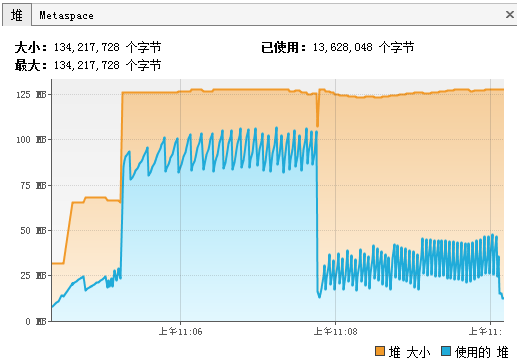
In Eclipse, I right click on my Main class, select Run As -> Run Configurations .. in popup menu, and add these to VM arguments:
-Xms256m -Xmx256m -XX:+HeapDumpOnOutOfMemoryError
I still thinking that the must be somewhere memory leaks in Zay-ES, that’s why I add -XX:+HeapDumpOnOutOfMemoryError.
But when I restart the program I didn’t got what I expectant.
The frequency of GC is obviously higher, and the actual memory is less than 128 MiB ! This has proved that Zay-ES doesn’t actually have memory leaks.
Since the actual memory needed is smaller than I thought, I decided to continue to adjust the size of the heap memory. I set starting memory 32 MiB, maximum memory 128 MiB.
-Xms32m -Xmx128m
This time, the GC frequency is higher, the memory size has been more stable. But the GC frequency of this set is too high, and there is a full gc halfway through。
The game doesn’t feel good.
So I did it again.
-Xms64m -Xmx128m
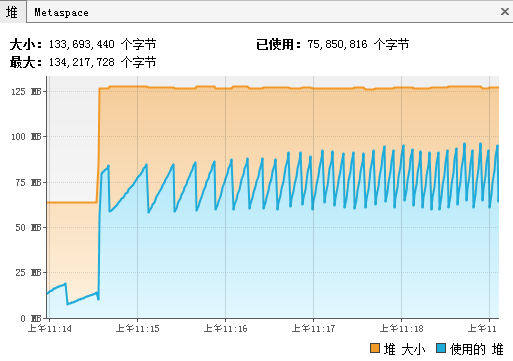
This run more smoothly, but also memory consumption in the acceptable range. I think it’s good enough for me.
This is what I learned, here I share it with you. Hope I can help someone. 