Greetings monkeys!!
My game has a decent frame rate on my laptop generally running at about 60 fps… While thats not great, its good enough for now… However there are “situations” when it drops to 8-9 fps, which is unusable…
And these “situations” doest seem to be places where i have to render loads of objects or complex meshes (from what i can tell.)
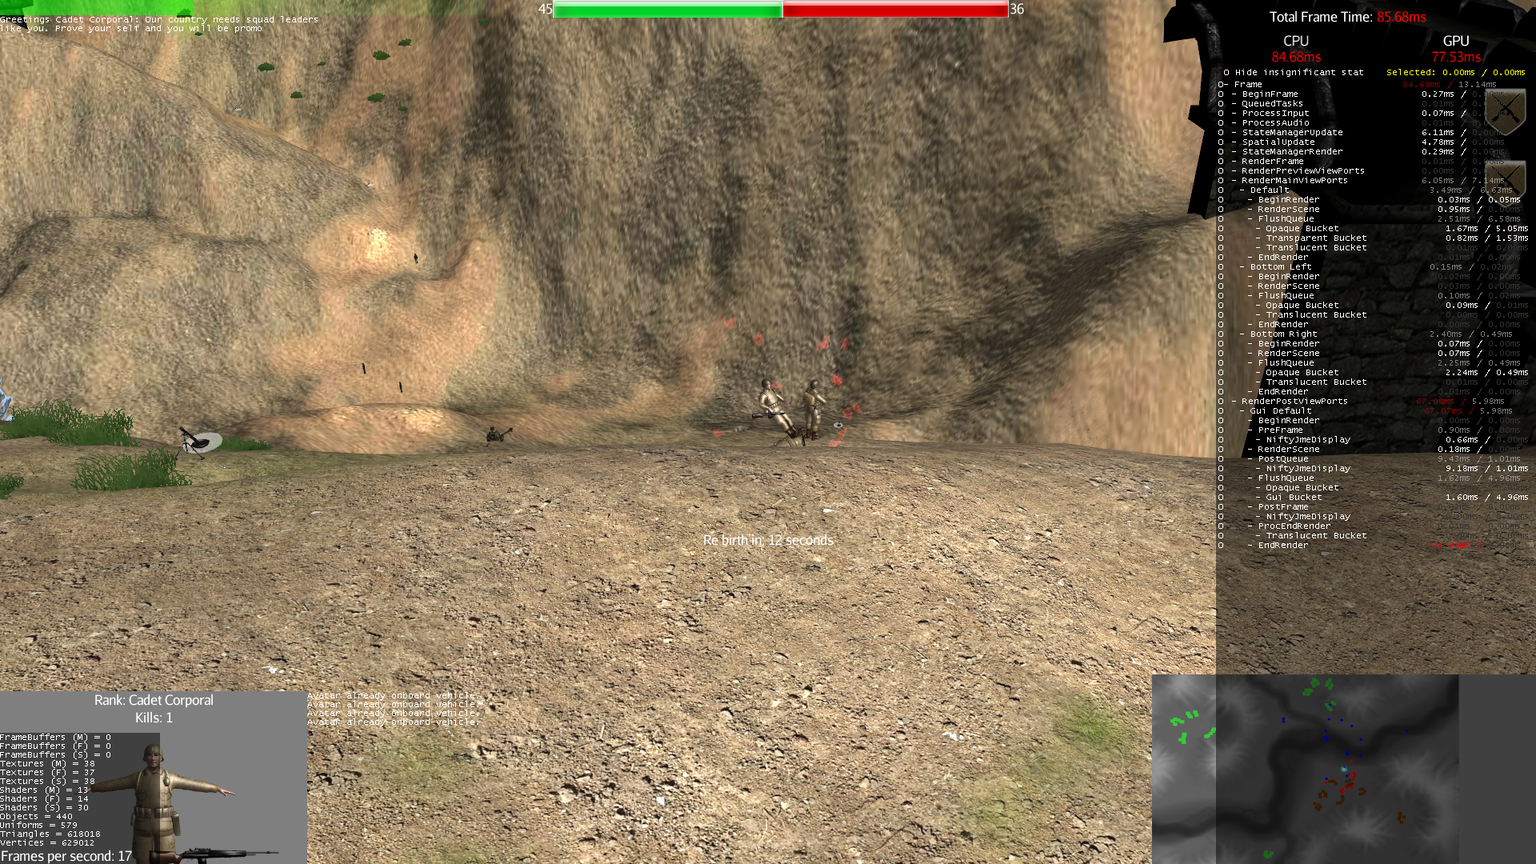
thanks to the new profiling tool from @nehon i tracked it down to the stage
RenderPostViewPorts 79.32ms/0.2ms
specifically
endRender 70.45ms/0.00ms
I have noticed that when the FPS is decent these sections take up negligible time… And when its bad its takes about 110ms of 120ms render cycle.
So i wanted to ask… What RenderPostViewPorts → endRender does? and what might cause it to take a longer time?
Before you say “read the code” i am reading it as we speak… but i’m having trouble finding what part of the code corresponds to this stage of the render cycle
I can’t say anything remotely helpful about your particular issue, but I will weigh in on the laptop graphics… I’ve been without my main workstation for some months now (due to moving residences and not getting it set up yet), so I’ve been doing everything on my laptop. Intel i7, integrated HD graphics (no dedicated GPU). One thing that’s become increasingly painful is that it’s quite prone to sporadic FPS drops for no apparent reason. Minecraft, FPS games, you name it… anything 3D will (seemingly sporadically) drop from a reasonable 45-60 FPS down to the teens or even 6 - 8 FPS. I don’t know if that’s at all related to what you’re experiencing, but since you mentioned seeing that happen on a laptop I thought I’d chime in just in case.