So as I hinted in the monthly WIP Sc thread I made a detailed profiler for the engine.
It’s called… DetailedProfiler \o/
usage is, for example in your simple init:
stateManager.attach(new DetailedProfilerState());
Here are the features:
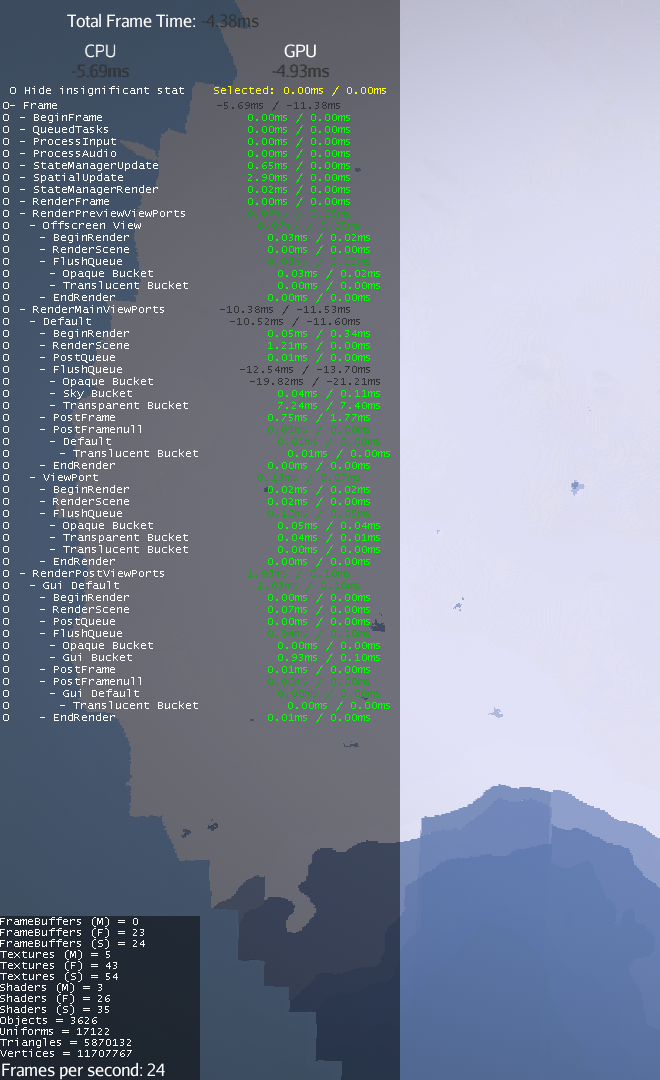
Except from the obvious, lines can be expended/collapsed to hide not needed lines.
Green value means that the time of the line is over 30% of the total frame time
Orange value means that the time exceeds 16,66ms (below 60fps)
Red value means that the time exceeds 33,33 ms (below 30fps).
Dimmed colors means that the time is mostly spent in a child action (idk if that’s clear…).
You can click on the “O” at the beginning of each line to select it. The “selected” entry at the top will be the sum of all selected lines.
Here you can see that I selected all entries relative to the SSAO filter so that the “selected” displays the total time spent rendering SSAO.
You can also click on “hide insignificant stat” to hide 0.00 lines that are most probably not the bottleneck of the rendering, and keep the view clear.
If you have some questions shoot them here…
I’d like to dd the possibility to add custom profiling steps so that you can split your update loop in several step for better cpu profiling.
mhh could be yes… but the file could grow huge is a small amount of time
here I display average values over 100 frames, and depending where you look in the scene it can vary a lot… idk if writing a file with the stats without the context would be very interesting… but yeah it can technically be done
nope MSAA is set to 1x But I noticed this only happens with vsync off and fullscreen enabled.
btw: It would be cool if there is an official way to customize the profiler translation. At the moment it is forced to the left side of the scree the dirty way inside the update loop:
I realize I’ve put the profiler in com.jme3.post which is a poor choice. At the beginning it was just meant to be a post process profiler… so I may change it in the next commit, so if you guys are using it you’ll have to fix your imports.
Awesome! thank you for the fast fix Maybe you can add a getter for the ui Node? Because otherwise I have to compare Strings every frame at the guiNode (see my code example)


 But I noticed this only happens with vsync off and fullscreen enabled.
 Maybe you can add a getter for the ui Node? Because otherwise I have to compare Strings every frame at the guiNode (see my code example)