A) I have multiple geometries (different shapes), all of them using the same one Material instance (with texture loaded from an image file).
B) I have multiple geometries (different shapes), each of them using its own Material instance. It happens that all the materials use the same texture from one image file. Same parameters for all materials, but new Material instance is created for each Geometry object.
My question is:
Would program A work faster / more efficiently than B, in term of FPS?
I’m not sure how does jME supply GPU with data in case when multiple materials use the same texture image. I’m also not aware if GPU itself would make some internal optimization if it detects the same image is used within different shaders, or something… Hence my question.
I’d also be grateful it someone could confirm if my following thinking is correct:
consider l have multiple Material instances all using the Common/MatDefs/Misc/Unshaded.j3md as base, but with different parameters set. It means that from GPU perspective there is only one shader in use (since all materials use the Unshaded.j3md) and this shader will process different data parameters for each material. In case if some of the materials use the same texture, the corresponding shader executions will be accessing the same instance of texture data, and no unnecessary image data transfer to GPU will take place.
Does that make any sense?
The case where it gets slightly more complicated is with “defines” since that recompiles the shader for different defined values… but JME caches and shares those, too.
For example, because a define gets set when Unshaded has a color map versus when it doesn’t… then if one of your materials has a color map and another doesn’t then that’s two separate shaders. But it’s only two separate shaders even if you have a dozen with no color maps and a hundred with a dozen different textures… just two shaders.
There are some limitations (e.g. animations) but generally you want to batch geometries to reduce the amount of calls to the GPU (even if it means processing extra triangles off screen).
Interesting.
I was actually going to do something opposite. That is: split large geometries to smaller pieces in order to be able to hide (culling) the distant parts to reduce triangles count.
So the question is - what will be better: lower count of geometries, or lower count of triangles? I guess that depends on the exact numbers and must be verified in practice.
I’m aware the optimization I’m thinking of is kind of premature
On the other hand, I already had constant FPS drops to 24, with shadows disabled, so that was worrying. I wanted to make sure this is possible to deal with in jME before putting more work into my project. I already managed to bring the FPS back to 100 (my limit) with some optimization (culling distant objects of some sort) and decided to sink into the topic a bit more, while I have the occasion, just to learn
Note that “FPS” is not really a good measure of performance. An application that randomly oscillates between 20 and 100 FPS might run smoothly at ‘vsync’. Many factors come into play.
It’s also human nature to put more stock in large swings in FPS values when it actually could mean very little change in ‘frame time’.
Operating under vsync should generally be the norm as it allows some overlap in processing that is otherwise impossible. The GPU also isn’t wasting time (and heat) drawing frames that no one will ever see. From there you can pull up detailed profiling to see where your time is going and make adjustments based on that.
Expanding to this the BasicProfilerState and DetailedProfilerState, those are very handy.
The first thing to discard is any excessive CPU usage in your update loop.
I always have vsync enabled.
My update loop is basically empty, all I do is loading world mesh and multiple object meshes. I will remember to use the profiler in the future.
The fps drops were due to too many static meshes being displayed, I think.
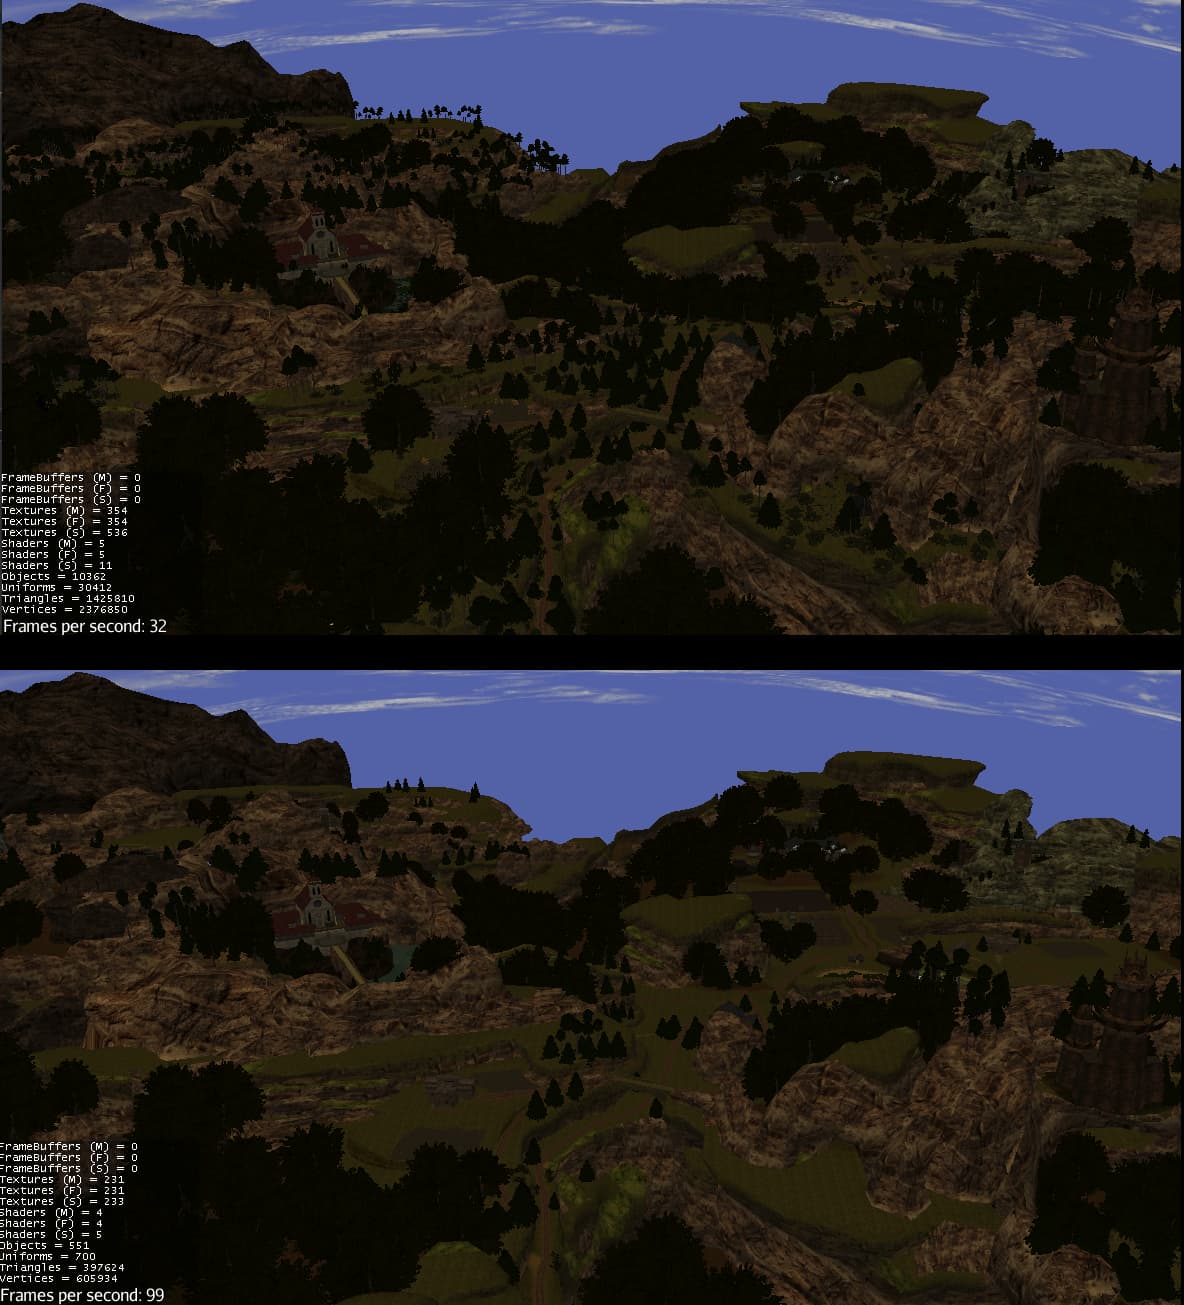
Reducing triangles count by culling distant object increases my FPS from constant ~30 to constant 100 (100 being set as a limit).
In general, number of triangles matters much less than the number of objects. 10,000 is a LOOOOOTTTTT of objects. At least one draw call per object. Draw calls are best kept to a minimum.